
Service Robot KPI Benchmarks, What Good Actually Looks Like in 2026
At a glance: Most robot business cases are approved on promised numbers and audited on none. This guide defines the seven operational KPIs that survive a finance review, gives defensible 2026 target ranges, and shows the baseline arithmetic you need before signing.
Why Robot Projects Fail the Post-Implementation Audit
The failure is rarely mechanical. It is measurement. A facility signs off on a robot deployment with three numbers in mind, headcount avoided, area cleaned, and payback period, and then discovers eighteen months later that none of them can be reconstructed from the data the fleet actually records. The finance team asks for evidence and gets a dashboard nobody defined.
The problem is structural, not technical. Robot vendors supply operational telemetry, uptime, battery cycles, task counts, while facility managers are accountable for service outcomes. The two datasets were never joined, because nobody specified the join key at procurement time. The seven KPIs below are the join key. Each has a defensible 2026 target range drawn from operating fleets, and each is measurable from data that a standard autonomous fleet already logs.
The Seven KPIs That Survive a Finance Review
There is no universal target. A hospital corridor fleet and an overnight office-cleaning fleet should be held to different numbers, because the constraints differ. What follows are ranges that hold across mixed commercial deployments, with the reason each range exists.
1. Utilisation Rate (Target: 55–75%)
Utilisation is productive robot-hours divided by available robot-hours across the operating window. Below 55% you are paying capital cost for a machine that is idle; above 75% you have no surge capacity and maintenance windows start eating into service delivery. The number that matters is not the peak day. It is the 30-day rolling median, because a fleet that looks busy during a site visit can be idle for the other twenty-nine days.
A common trap: measuring utilisation against a 24-hour clock inflates the figure. Measure against the hours the site is actually operable. A robot that runs 8 hours in an 8-hour operating window is at 100% utilisation, not 33%.
2. Coverage Rate (Target: 92–98% of scheduled area)
Coverage is the share of the scheduled area the fleet actually reaches in a cycle, measured by the robot's own map, not by staff observation. Persistent coverage below 92% usually means one of three things: doorway and threshold geometry the robot avoids, cordoned areas that were never removed from the route, or floor-marking conflicts. All three are site problems presented as robot problems.
3. Interventions per 1,000 m² Cleaned (Target: 0.3–0.9)
An intervention is any human action required to keep the fleet running, freeing a robot from an obstacle, manually recharging, clearing a sensor, resetting a task. This is the single most predictive maintenance KPI in commercial cleaning fleets. It is a leading indicator, not a lagging one: intervention rates rise before downtime rises, typically by two to four weeks.
Bands matter more than absolutes. A fleet that sits at 0.4 interventions per 1,000 m² for a quarter and then drifts to 0.8 has a developing problem, even though 0.8 is still inside the target range. Trend the number weekly.
4. First-Pass Clean Rate (Target: 85–93%)
The share of cleans that pass inspection without a re-run. This is what the client actually buys, and it is almost never instrumented. Where a site has no formal inspection, use the complaint-log proxy: the number of quality complaints per 1,000 m² cleaned. Set the baseline during the first month of operation, then hold the fleet to it.
5. MTBF, Mean Time Between Failures (Target: 400–800 operating hours)
MTBF is total operating hours divided by the count of failures that required a repair action. The wide range is genuine: a simple scrubber deck in a clean warehouse will sit at the top of it, while a machine working outdoor mixed surfaces with heavy debris loading will sit lower. What is not genuine is an MTBF computed without defining a failure. Agree the definition in the contract. Anything that requires a technician, or anything that stops a scheduled task, are two very different thresholds.
6. MTTR, Mean Time to Repair (Target: 24–72 hours)
MTTR covers the clock from failure report to the robot returning to service, including parts lead time. This KPI is where imported fleets live or die. A machine with a 12-hour repair time but a 30-day part lead time has a real MTTR of 30 days. Insist that the contract states MTTR broken into diagnosis, part supply and labour, because a single blended number hides the part-supply risk inside it.
7. Cost per 1,000 m² Cleaned (Whatever the Baseline Says)
This is the only KPI that matters to the executive sponsor, and it has no universal benchmark because labour rates vary by geography. It must be computed from site data. The formula is total cost of ownership for the period, capital amortised plus consumables, electricity, service contract and supervision, divided by thousands of square metres actually cleaned. Any business case that skips the denominator is a business case that cannot be audited.
Baseline First, Then Buy: a 14-Day Measurement Protocol
You cannot judge a robot against no baseline. Before any procurement, run a fourteen-day measurement of the incumbent manual process. It costs almost nothing and it converts the entire business case from an argument into arithmetic.
Days 1–3: capture the current cleaning cost per square metre, including supervision and consumables, not just hourly labour. Days 4–7: measure actual coverage and cycle time for the areas you intend to automate, using a walk-through log rather than the cleaning schedule, because schedules are aspirational. Days 8–11: record the quality complaint rate and any re-work. Days 12–14: write down the intervention-equivalent. How many times staff stop what they are doing to solve a problem in the target areas.
At the end you have your own benchmark set. Now every robot KPI has a comparator, and the vendor's promised utilisation figure can be tested against the coverage the manual process actually achieved. This is also the only honest way to compute payback, which depends entirely on the delta between these two states.
For the arithmetic that turns these baselines into a defensible payback figure, see our worked model in the cleaning robot labour cost model, and for the cost of the machine being idle see measuring downtime cost and OEE.
Instrumenting the KPIs Without New Software
A frequent objection is that this requires an analytics platform the site does not have. It does not. Four of the seven KPIs are computable from a monthly export of the fleet's own task log, utilisation, coverage, first-pass proxy and cost per unit area. Interventions and MTBF/MTTR need one added column: a simple shift-log field where a supervisor records any human action taken on a robot, with a timestamp and a one-word cause.
That single column, entered in under twenty seconds per event, is what turns an operational fleet into an auditable one. It also produces the evidence needed for a warranty claim. A documented pattern of recurring interventions on the same assembly is dramatically harder for a supplier to dismiss than a single complaint.
If you are evaluating the software layer that will hold these numbers, the evaluation criteria are covered in how to evaluate custodial robot management platforms. Be clear about the distinction: the platform stores and displays KPI data, but the definitions above are yours to set, and they belong in the contract rather than in a dashboard configuration screen.
Putting the KPIs Into the Procurement Document
A KPI without a contractual consequence is a suggestion. Three clauses convert the framework into leverage, and none of them requires the supplier to accept unlimited liability.
First, a definition annex. State the seven KPIs, the measurement window (30-day rolling), the data source and the calculation. Ambiguity here is what suppliers exploit at claim time. Second, a stabilisation period. Accept that the first 30–60 days are commissioning and that no KPI binds during them; begin measurement formally on an agreed date. Third, a review cadence. A quarterly KPI review with a remediation window, escalating to a service credit only if the same KPI misses in two consecutive quarters.
That structure is proportionate, and it is far more likely to be signed than an aggressive service-level agreement. The template structure for the wider document is set out in how to write a service robot RFP, and the warranty side of the same question, what happens when a KPI miss is caused by a failed component rather than a process, is covered in warranty and service contract terms.
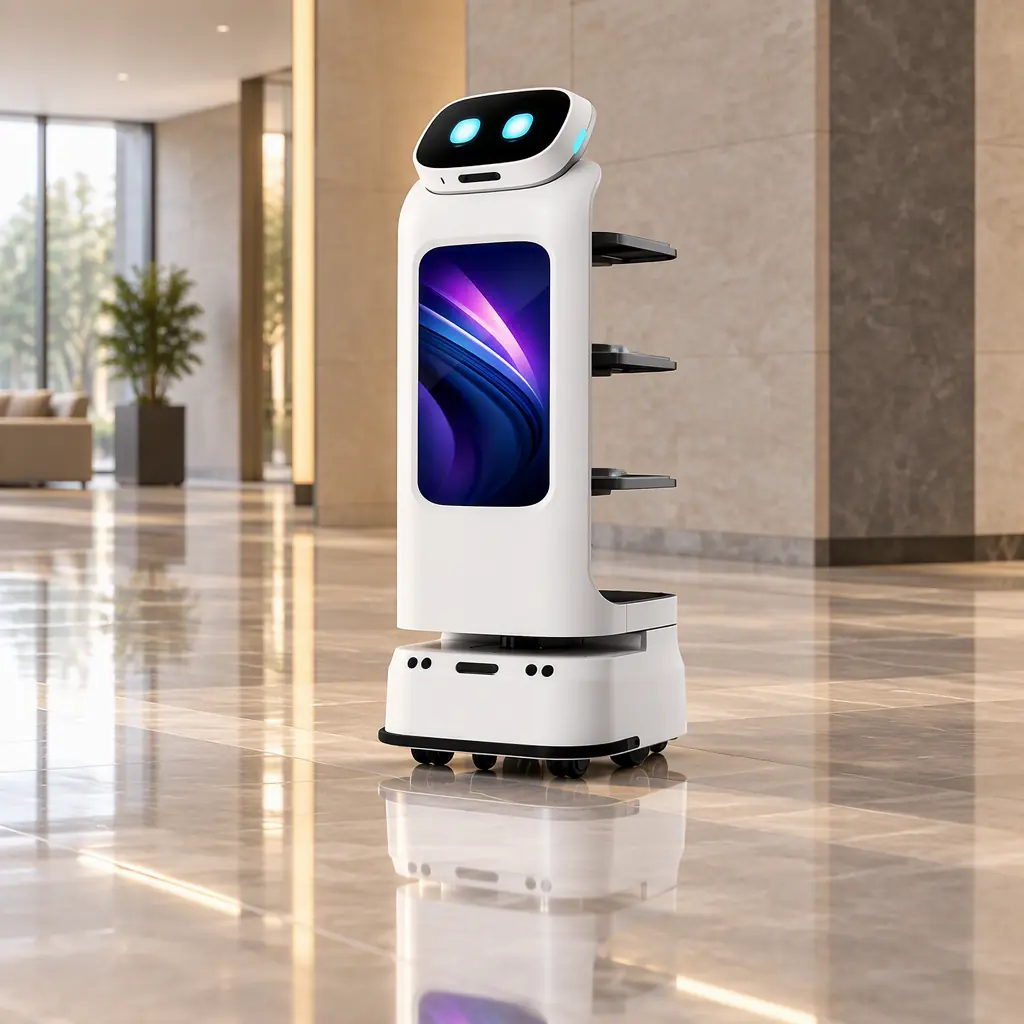
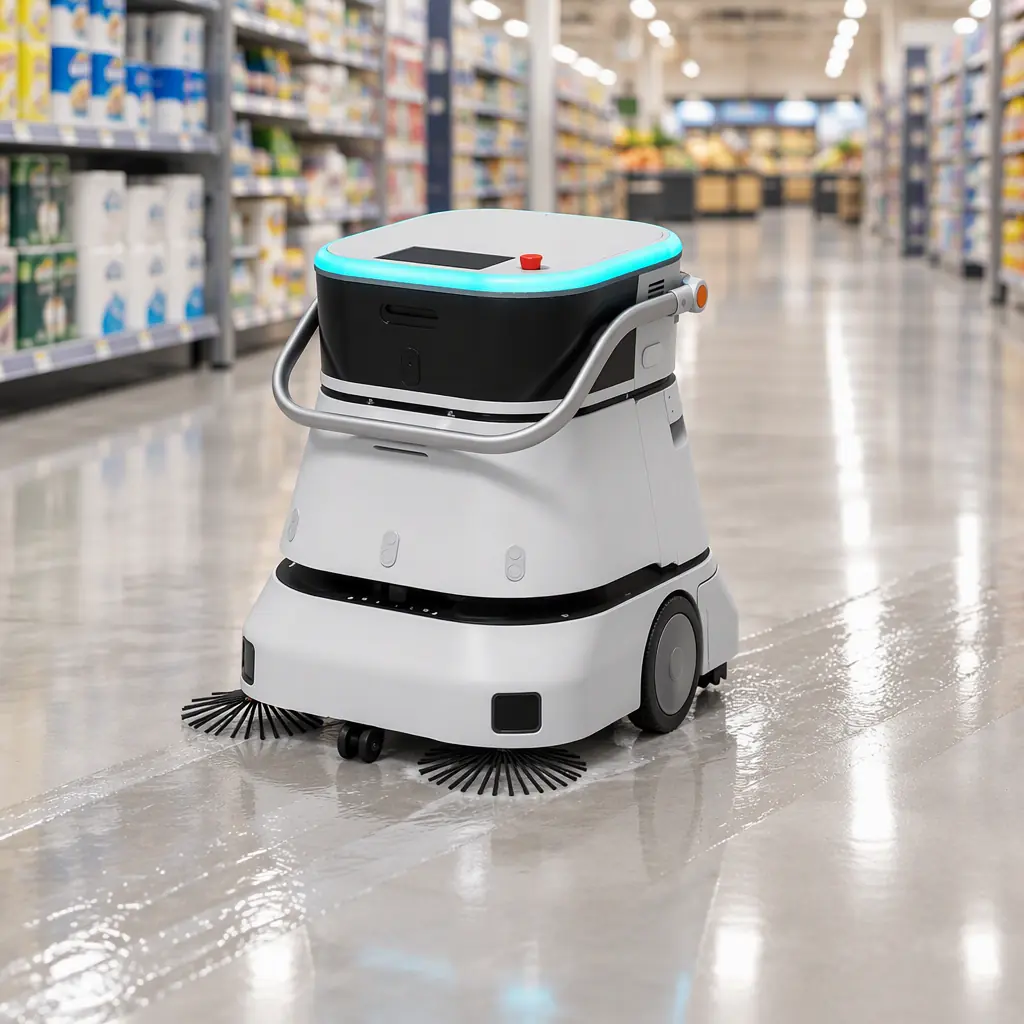
AOMAN FUTURE ships fleet telemetry as standard on the D1 delivery and C1/C2 Pro cleaning platforms, with task logs exportable for exactly this kind of measurement. If you want the data dictionary before you specify the KPI annex, request the telemetry schema and we will send it with a sample export.