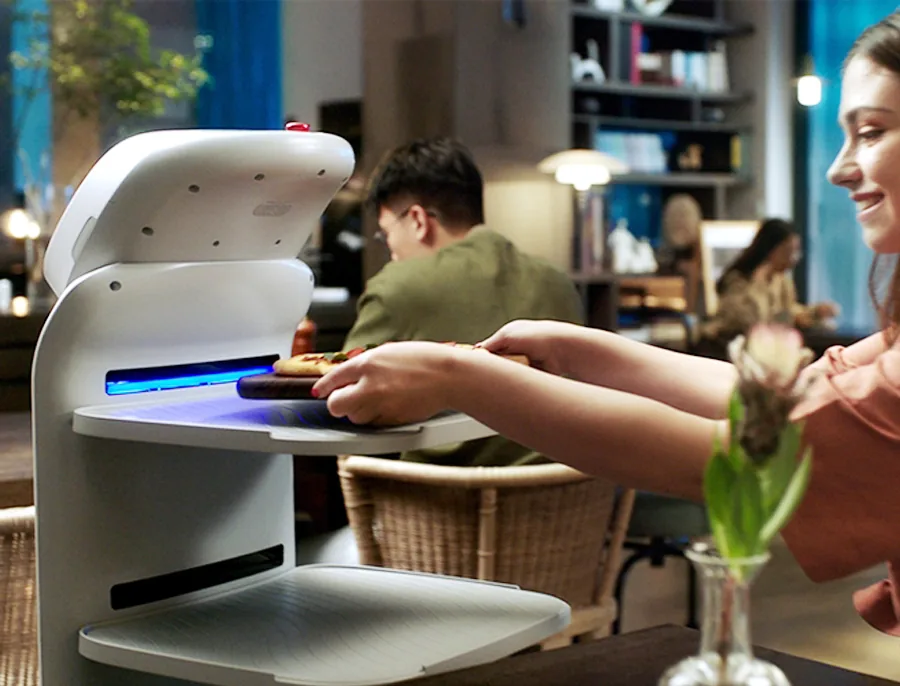
Service Robot Budget Planning 2026: Real Cost Calculator by Facility Size and Robot Type
At a glance: AOMAN D1 carries 40 kg per run on four trays, but the first-year cost of a delivery fleet is far more than the unit price: mapping, door retrofits, training and software licensing typically add 40–60% to the hardware line. This guide prices the full seven-line budget by facility size so you can defend the number in a 2026 capital request.
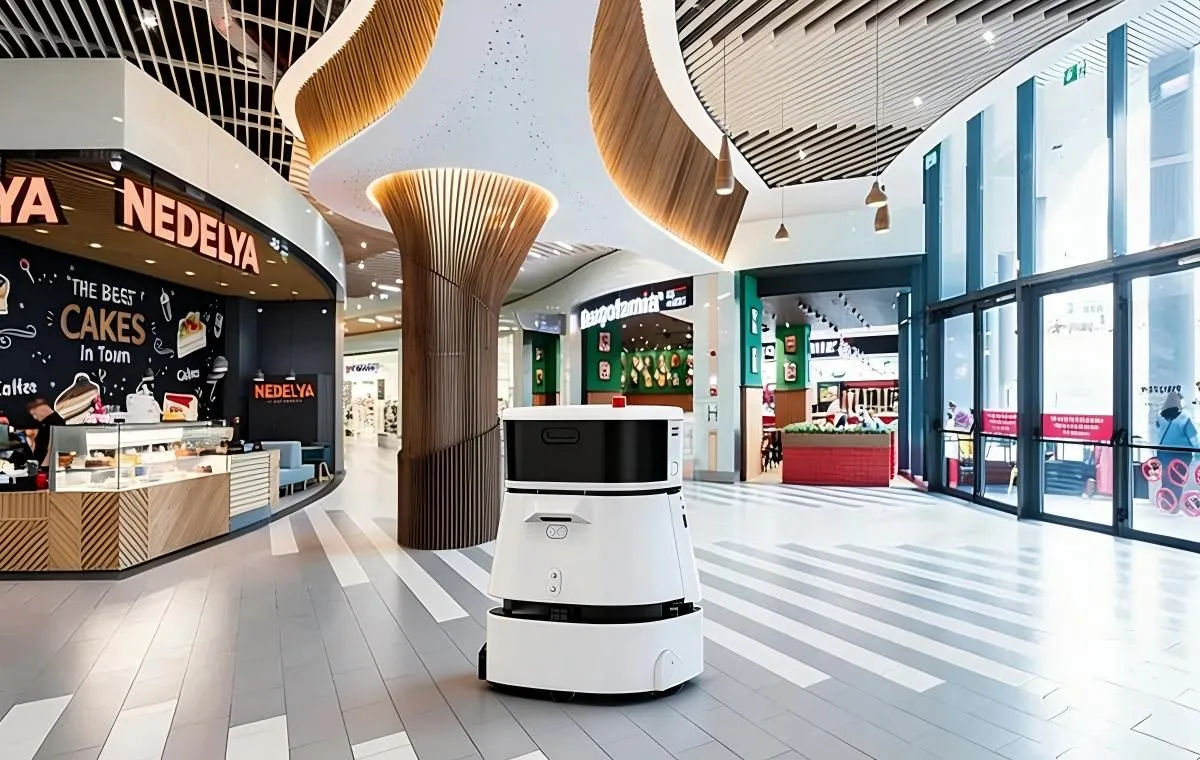
When a facility manager asks “what is the budget for service robots?” the vendor answers with a unit price. The question you actually meant — what does this technology cost in year one, ready to run? — has seven line items, and the unit price is only one of them. Mapping the space, retrofitting doors, staff training, software licensing and a contingency for site surprises routinely add 40–60% on top of the hardware figure. The vendor did not mislead you; they answered the narrower question.
The gap between quoted price and deployed cost is the largest single source of budget overruns in service robot programs. Procurement teams budget against the quote, discover the gap during implementation, and then either ask for supplemental funding — delaying the rollout by a month or more — or cut scope, deploying fewer units than the workload requires and degrading the return from day one. This guide structures the budget the way a deployment actually spends it, with illustrative ranges you can adapt to your site.
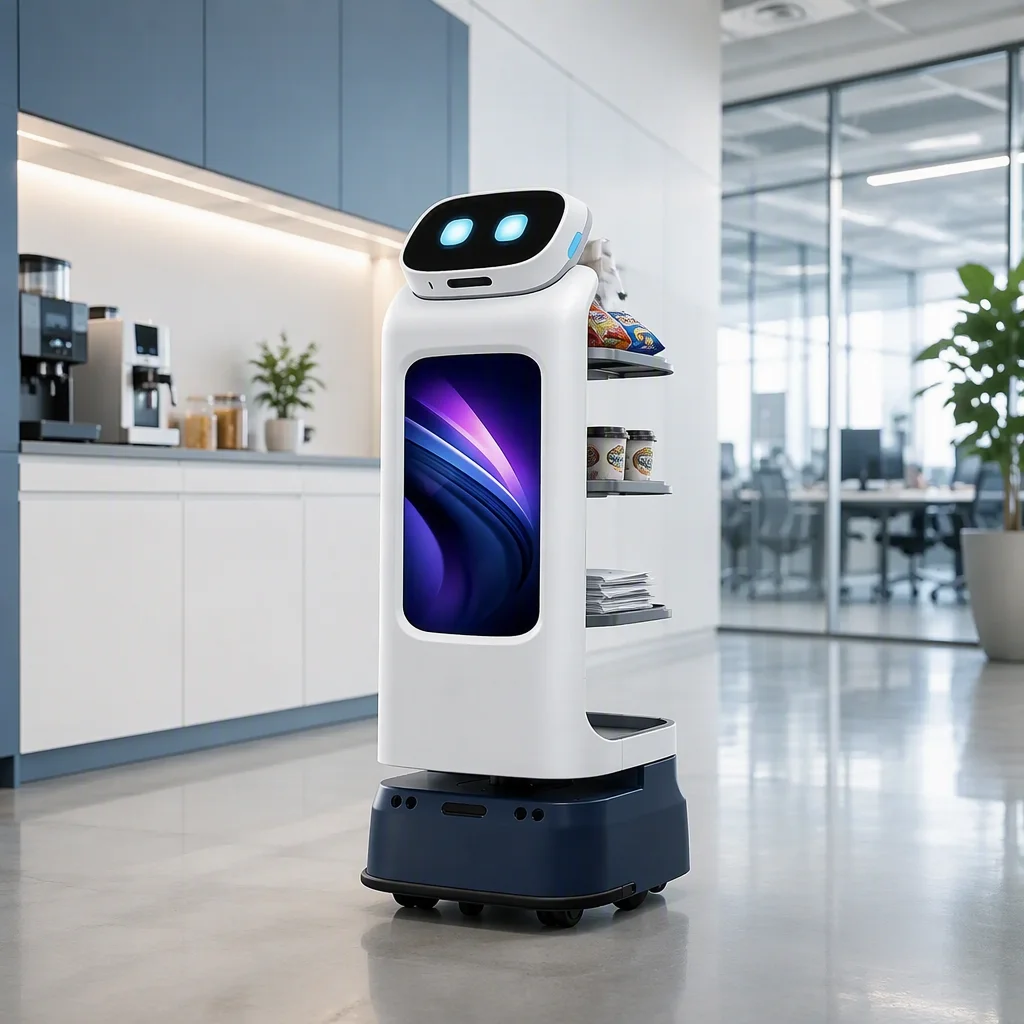
The Seven Line Items Behind a Real Robot Budget
A service robot budget has seven line items. The vendor quote covers one of them — the hardware. Here is the full structure, with typical 2026 price bands for commercial-grade units and the fleet sizes most deployments run:
Line 1: Hardware (Vendor-Quoted)
| Robot Type | Typical Unit Cost | Typical Fleet Size |
|---|---|---|
| AOMAN D1 delivery robot (40 kg payload, four trays) | $12,000–$18,000 | 3–8 units |
| AOMAN C1 large cleaning robot (2,040 m²/h, 790 mm squeegee) | $22,000–$38,000 | 2–4 units |
| AOMAN C2 Pro compact cleaner (70 cm desk clearance) | $15,000–$22,000 | 2–4 units |
| AOMAN G1 guidance robot (15 DoF, 5 m voice pickup) | $15,000–$30,000 | 1–3 units |
These bands reflect commercial units with industrial components — LiDAR, industrial drive motors, replaceable batteries. Household-grade robots with shorter service lives and limited duty cycles cost less but are not comparable for continuous commercial operation. See the full product line for specifications.
Line 2: Deployment and Site Mapping ($2,000–$6,000 per site)
Every autonomous robot requires SLAM-based mapping of its operating environment. This is not a one-time upload of a floor plan — it is a physical process in which the robot is walked through the facility to build a spatial map, identify no-go zones and calibrate the docking and charging station. Multi-floor deployments require separate mapping per floor; the navigation technology section covers how the map is built. Budget $500–$800 per 10,000 sq ft of mapped space, and factor in floor availability: most facilities can only spare corridors for mapping overnight.
Line 3: Facility Modifications ($1,500–$15,000)
Robots interact with physical infrastructure in ways that people do not. Common modification costs:
- Automatic door openers: regardless of robot model, any corridor the robot traverses with doors that lack automated openers needs a retrofit — $1,200–$2,500 per door in typical quotes. This is the single most commonly overlooked facility cost. Note the geometry: AOMAN D1 is rated for 70 cm clear aisles, while AOMAN C1 needs 85 cm of passage — tight service corridors may need a C2 Pro instead of a full-size C1.
- Elevator integration: multi-floor delivery requires the robot to call and ride elevators autonomously. Elevator IoT modules typically cost $3,000–$8,000 per elevator bank plus integration labor, and the elevator must be the vendor’s supported model.
- Charging station electrical work: each docking station needs a grounded outlet within reach of the docking location. If your facility lacks outlets in the designated docking zones, budget $400–$1,200 per station for electrical work.
- Wi-Fi coverage assessment and remediation: fleet management streams telemetry from every unit; dead zones cause navigation failures, not just blank dashboards. Budget $800–$2,000 for a site survey plus any access points needed.
Most existing facilities need work in at least two or three of these categories. Facilities designed for robots from the start rarely do — auditors and facility managers should ask for the coverage map before committing.
Line 4: Software and Fleet Management Licensing ($1,800–$6,000/year)
Fleet management platforms — the software layer that schedules tasks, tracks robot status and reports utilization — are typically licensed per robot per year. Budget $50–$120/month per robot for the fleet layer, plus any middleware needed to connect it to your existing facility systems (BMS, CMMS or work-order platform).
Line 5: Training and Change Management ($1,500–$5,000)
Staff training is not a one-hour vendor webinar. Budget for operator training on-site (a few hours per shift supervisor plus shorter sessions for frontline staff who interact with robots), refreshers for new hires, and the internal communications that go with it: announcements, FAQ documents, and a feedback channel. Getting this wrong — staff who perceive the robots as imposed — shows up directly as low utilization, which erodes the return no matter how good the hardware is.
Line 6: Contingency (15–20% of Lines 1–5)
Unexpected costs materialize with near-certainty: a docking station has to be relocated after deployment; a pilot-validated throughput does not scale linearly, so one more unit is needed; or a legacy access-control system requires custom API work. Budget 15–20% contingency. If you do not spend it, it drops to the bottom line. If you need it and did not budget it, the program stalls.
Line 7: Annual Recurring Costs (Year 2+)
Key recurring items to carry into the operating budget:
| Cost Category | Annual Estimate | Note |
|---|---|---|
| Maintenance contract | 8–12% of hardware cost | Post-warranty; typical warranty 12–24 months |
| Battery replacement | $400–$900/unit | Every 18–24 months depending on cycle count |
| Consumables (cleaning) | $300–$800/unit/year | Solution, filters, brushes, mop pads |
| Software licensing | $600–$1,440/unit/year | Fleet management platform |
| Staff labor (robot management) | 0.3–0.5 FTE per 5 robots | Filling, emptying, clearing obstructions, troubleshooting |
Budget Scenarios by Facility Size
The scenarios below are illustrative models for three facility sizes, mixing delivery, cleaning and guidance robots in a realistic configuration. Treat them as a starting frame for your own line-item quote, not a price list.
Small Facility (50,000–150,000 sq ft): 3–5 Robots
Typical: a boutique hotel (120 rooms), a single-floor corporate office, a medium-sized supermarket. In a publicly documented deployment, a ramen chain in Kyushu, Japan runs AOMAN D1 delivery units through dining corridors, carrying several dishes per trip — a two-robot configuration with one cleaner covers the same floor plan here.
| Line Item | Low | High |
|---|---|---|
| Hardware (3 units) | $36,000 | $75,000 |
| Deployment + Mapping | $2,000 | $4,000 |
| Facility Modifications | $1,500 | $6,000 |
| Software Licensing (Year 1) | $1,800 | $4,000 |
| Training | $1,500 | $3,000 |
| Contingency (15%) | $6,400 | $13,800 |
| Year 1 Total | $49,200 | $105,800 |
| Annual Recurring (Year 2+) | $5,000 | $12,000 |
Medium Facility (150,000–500,000 sq ft): 6–12 Robots
Typical: a 300-room full-service hotel, a mid-size hospital (200–400 beds), a regional shopping mall. A mixed fleet of delivery units, large cleaners and one guidance robot is the common configuration here; see the industry pages for how each vertical combines them.
| Line Item | Low | High |
|---|---|---|
| Hardware (8 units, mixed types) | $120,000 | $240,000 |
| Deployment + Mapping | $4,000 | $8,000 |
| Facility Modifications | $5,000 | $15,000 |
| Software Licensing (Year 1) | $4,800 | $9,600 |
| Training | $3,000 | $5,000 |
| Contingency (15%) | $20,500 | $41,600 |
| Year 1 Total | $157,300 | $319,200 |
| Annual Recurring (Year 2+) | $18,000 | $35,000 |
Large Facility (500,000+ sq ft): 12–25 Robots
Typical: a 1,000-room convention hotel, a major hospital (600+ beds), a large corporate campus with multiple buildings. At this scale the software, service and staff-management lines deserve as much negotiation attention as the hardware count.
| Line Item | Low | High |
|---|---|---|
| Hardware (15 units, mixed types) | $250,000 | $500,000 |
| Deployment + Mapping | $8,000 | $15,000 |
| Facility Modifications | $10,000 | $30,000 |
| Software Licensing (Year 1) | $9,000 | $18,000 |
| Training | $5,000 | $8,000 |
| Contingency (15%) | $42,300 | $85,700 |
| Year 1 Total | $324,300 | $656,700 |
| Annual Recurring (Year 2+) | $35,000 | $70,000 |
The variance between the low and high ends reflects the difference between facilities that are “robot-ready” — modern construction, good Wi-Fi, automated doors — and those needing significant retrofit. If capital expenditure is the blocker rather than the robot itself, the flexible financing models covered in the RaaS guide convert these CapEx figures into monthly operating spend.
The Budget Comparison: Robot Labor vs. Human Labor
The budget only makes sense against the alternative. At developed-market wage levels, an illustrative year-one comparison looks like this:
| Task | Human Annual Cost (fully loaded) | Robot Annual Cost (amortized) | Illustrative Breakeven |
|---|---|---|---|
| Hotel delivery (1 shift) | $38,000–$52,000 | $12,000–$16,000 | 4–6 months |
| Floor cleaning (1 shift, 50K sq ft) | $42,000–$58,000 | $18,000–$24,000 | 6–9 months |
| Front-desk guidance (1 shift) | $45,000–$65,000 | $20,000–$28,000 | 7–11 months |
Human labor figures assume a 25–35% benefits burden on wages plus training time and the recruiting cost of turnover — replacement spending that scales with your actual attrition rate and local labor market. Robot figures take the fully burdened year-one total from the scenario tables above and spread it across an expected service life of five to seven years for industrial-grade units. The comparison also ignores the factors neither column shows: a robot that works nights without premiums, and a human worker who handles judgment calls no robot can. Most procurement teams land on a mixed model, and a publicly documented deployment in the Netherlands — a Korean BBQ restaurant in Gaja — shows exactly that shape: D1 robots handle the repetitive table runs while staff train their attention on the tables and the grill.
Budgeting for the Hidden 0.5 FTE
Every service robot deployment absorbs roughly 0.3–0.5 FTE of existing staff time — not for operating the robots, but for managing them. Whether this becomes a titled “robot coordinator” role or folds into a facilities supervisor’s job, it covers:
- Morning checkout: verifying all units are charged, operational and at their start positions
- Obstruction clearing: removing carts, boxes and event debris that block mapped routes
- Consumable replenishment: filling water and solution tanks, replacing mop pads, emptying collection bins
- Basic troubleshooting: resolving the stoppages that are environmental — blocked path, closed door, weak Wi-Fi — rather than mechanical
- Vendor coordination: scheduling service, applying software updates, logging warranty claims
Budget this headcount explicitly. If you absorb it into an existing role without reducing that person’s other duties, you are under-resourcing the deployment — and the most common post-deployment complaint, “the robots keep stopping and nobody fixes them,” traces directly to unbudgeted robot-management labor. Fleet management software reduces the monitoring share of that time, but a human still has to physically clear obstructions and refill tanks.
Tell us your floor plan, shifts and staffing model — the AOMAN FUTURE team will return a budget-grade, line-item estimate for your facility type within 24 hours. Request pricing to get started.