Service Robot Speed Profiles: Acceleration, Deceleration and the Numbers That Decide Throughput
At a glance: A service robot's published top speed is the least useful number in its specification. What decides whether a robot is safe in a busy lobby, productive on a long corridor and acceptable to the people walking beside it is the speed profile: the trapezoid, the acceleration ramp, the deceleration margin and the set of conditions that override all three. This guide gives the units, the arithmetic and the acceptance tests a buyer or facility engineer needs to compare two robots that both claim 1.2 m/s.
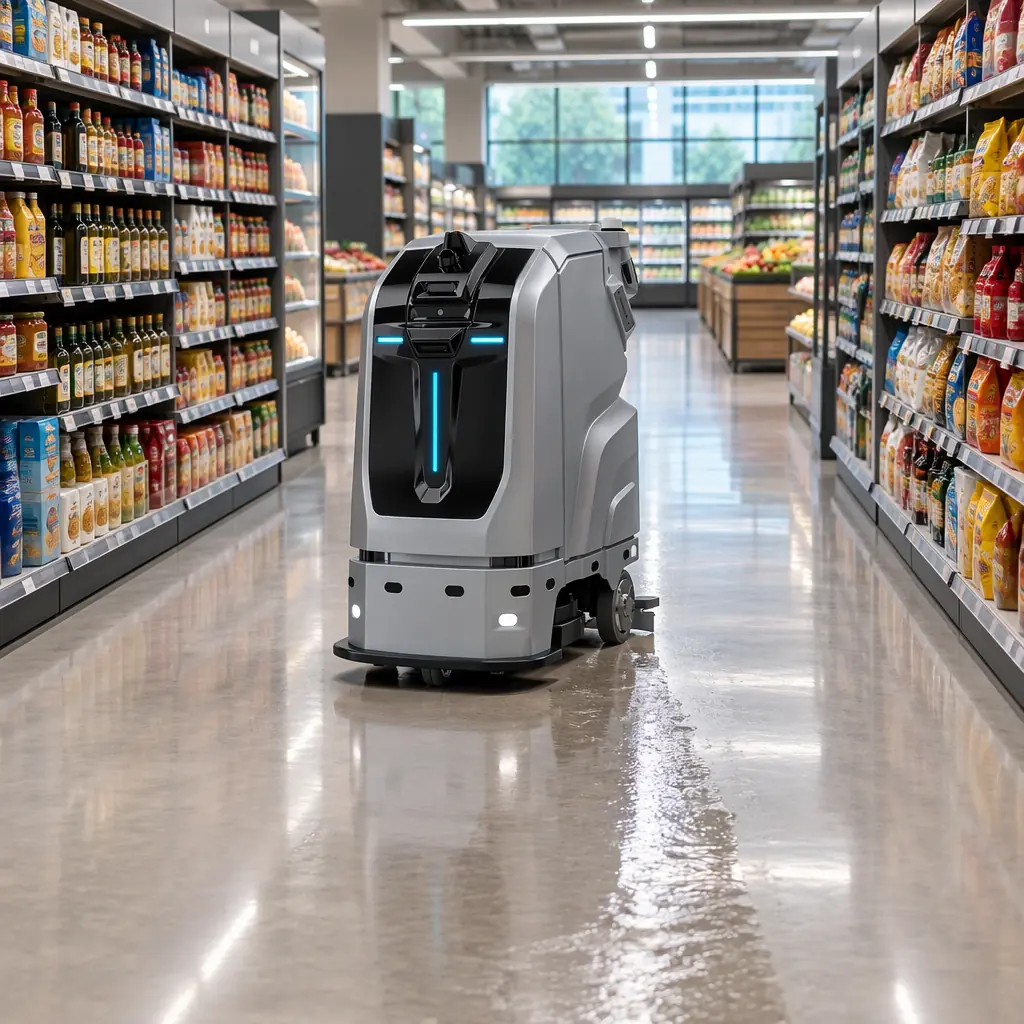
Two robots quote 1.2 m/s. One completes a 60 m supermarket loop in 78 seconds and the other takes 112, and neither number appears in the datasheet. The difference is in how each machine reaches and leaves its top speed, how it treats obstacles and people, and what its safety system does when the map and the world disagree. Speed is a profile, not a scalar, and the profile is what belongs in a tender.
The Trapezoid, in Units That Compare
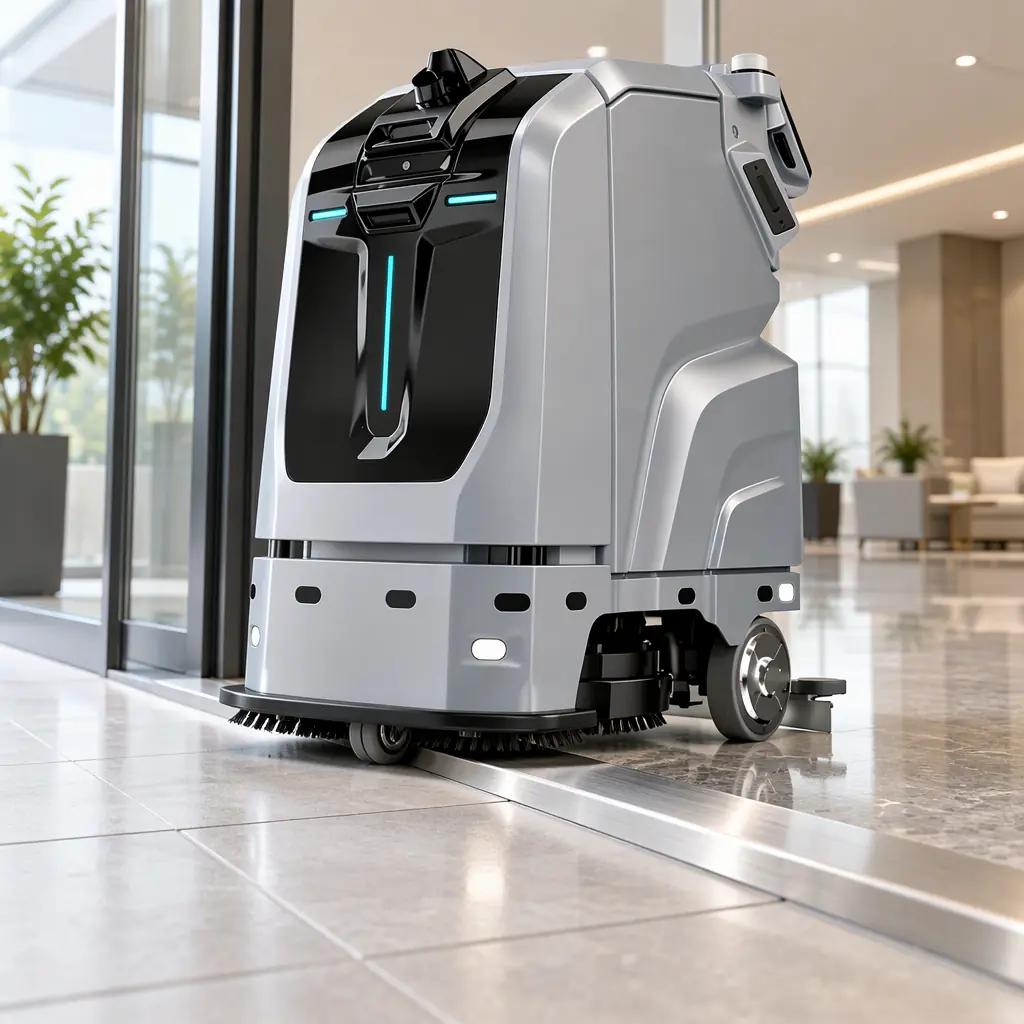
A service robot moves on a trapezoidal profile: acceleration to cruise, a constant-speed section, then deceleration to the target. Its real throughput is set by the two ramps as much as by the plateau, because most indoor segments are shorter than the distance needed to reach and hold top speed. For a scrubber limited to 0.5 m/s² of acceleration and 0.3 m/s of cruise, the move only reaches 13 percent of top speed, and the ramp dominates the timing.
| Term | Unit | Typical indoor values | Notes |
|---|---|---|---|
| Cruise speed | m/s | 0.3 to 1.2 m/s; 0.4 to 0.6 m/s for cleaning in public areas | The number in the brochure; rarely the achievable average |
| Acceleration | m/s² | 0.3 to 1.0 m/s² | Higher values increase payload shift and liquid slosh in scrubbers |
| Deceleration, normal | m/s² | 0.4 to 0.8 m/s² | Comfort limit for standing passengers and carrying trays |
| Deceleration, emergency | m/s² | 1.5 to 3.0 m/s² | Set by the safety system, not by the navigation stack |
| Ramp time | s | 0.6 to 2.5 s | Cruise divided by acceleration |
| Stopping distance | m | 0.15 to 0.6 m at indoor cruise speeds | Must be quoted with the surface and load it was measured on |
The units matter more than the numbers. An acceleration quoted in m/s² and a deceleration quoted in terms of stopping distance are not comparable, and suppliers mix them freely. Converting everything to metres, seconds and m/s² before any comparison is the first step in a tender evaluation, and it is the step most buyers skip.
Worked Throughput: Why Ramp Time Decides the Fleet Size
A supermarket with a 60 m perimeter loop, 0.5 m/s cruise, 0.5 m/s² acceleration and deceleration. At cruise the loop takes 120 s of pure travel. The four ramps cost about 8 s in total, because the cruise phases are long enough to reach full speed. Effective average for the loop is about 0.47 m/s, or 94 percent of cruise.
Now a hospital floor with 12 m corridors. Each segment reaches only 0.52 of cruise at 0.5 m/s², so the average over the segment is about 0.36 m/s. Add a stop at each end, with a 3 s dwell to align and one 2 s resume, and the effective average falls to about 0.30 m/s. The same robot at the same published speed covers ground 36 percent slower in the second building. Coverage arithmetic built on the brochure figure will overstate the fleet by a third.
| Environment | Segment length | Cruise | Effective average | Coverage penalty vs brochure |
|---|---|---|---|---|
| Warehouse straight run | 80 m | 1.2 m/s | 1.13 m/s | 6 percent |
| Supermarket perimeter | 60 m | 0.5 m/s | 0.47 m/s | 6 percent |
| Mall concourse with crowds | 25 m | 0.6 m/s | 0.42 m/s | 30 percent |
| Hospital ward corridors | 12 m | 0.5 m/s | 0.30 m/s | 40 percent |
| Office lobby, tight turns | 8 m | 0.6 m/s | 0.28 m/s | 53 percent |
The fleet sizing that follows from these numbers is set out in the deployment throughput planning guide, and the labour side of the same comparison in the cleaning robot labour cost model. The pattern that matters here is that short-segment buildings pay twice: once in ramp losses and once in stop-and-resume dwell.
What Overrides the Profile, and How Fast
A speed profile is only useful if the robot can leave it. Five conditions override cruise, and each should have a stated reaction time and resulting speed cap in the technical file.
| Condition | Typical response | Resulting speed cap | What to test |
|---|---|---|---|
| Person detected within the protective field | Immediate deceleration to stop or creep | 0 m/s, or 0.1 to 0.2 m/s creep for delivery units | Approach a stationary person from 3 m; measure stop distance and resume behaviour |
| Static obstacle outside the map | Replan or stop within the planning horizon | 0 m/s until a path is found | Place an unlisted box in the corridor, time the response and the path around it |
| Wet or contaminated floor | Reduced traction allowance | 0.2 to 0.3 m/s, longer deceleration distance | Run on a wet floor and measure stopping distance, not just speed |
| Threshold, ramp or cable mat | Controlled crossing | 0.1 to 0.2 m/s with a lift or tilt limit | Cross a 20 mm threshold and a loose cable mat; check for stalling and liquid slosh |
| Fleet congestion or a blocked aisle | Yield, wait or reroute | 0 m/s with a defined wait cap | Two robots in one aisle; measure the deadlock-free behaviour and the wait timeout |
Reaction time is the number that connects these rows to safety. A robot travelling at 0.6 m/s with a 0.3 s reaction time covers 0.18 m before the brakes engage, then about 0.3 m of stopping distance at 0.6 m/s². The protective field must extend beyond that total, plus the person's own approach speed, plus a margin. A protective field that assumes the robot is stationary is a common and invisible weakness in a layout drawing.
Floor condition deserves a note because it is the most under-tested variable. A cleaning robot works on exactly the wet surface that halves its friction coefficient. A machine that stops in 0.3 m on dry vinyl may need 0.7 m on the same floor wet, and its safety system must know that before it happens, either through a wet-mode speed cap or a measured friction estimate. The same logic applies to the surface it is cleaning versus the surface it crosses to get there: a scrubber on tile entering a carpeted lift lobby is on two different floors in ten seconds.
Human Factors: Why Slower Robots Are Sometimes Seen as Faster
Acceptance by staff and visitors is not a function of top speed. Three behaviours decide whether a robot is perceived as competent or as an obstruction.
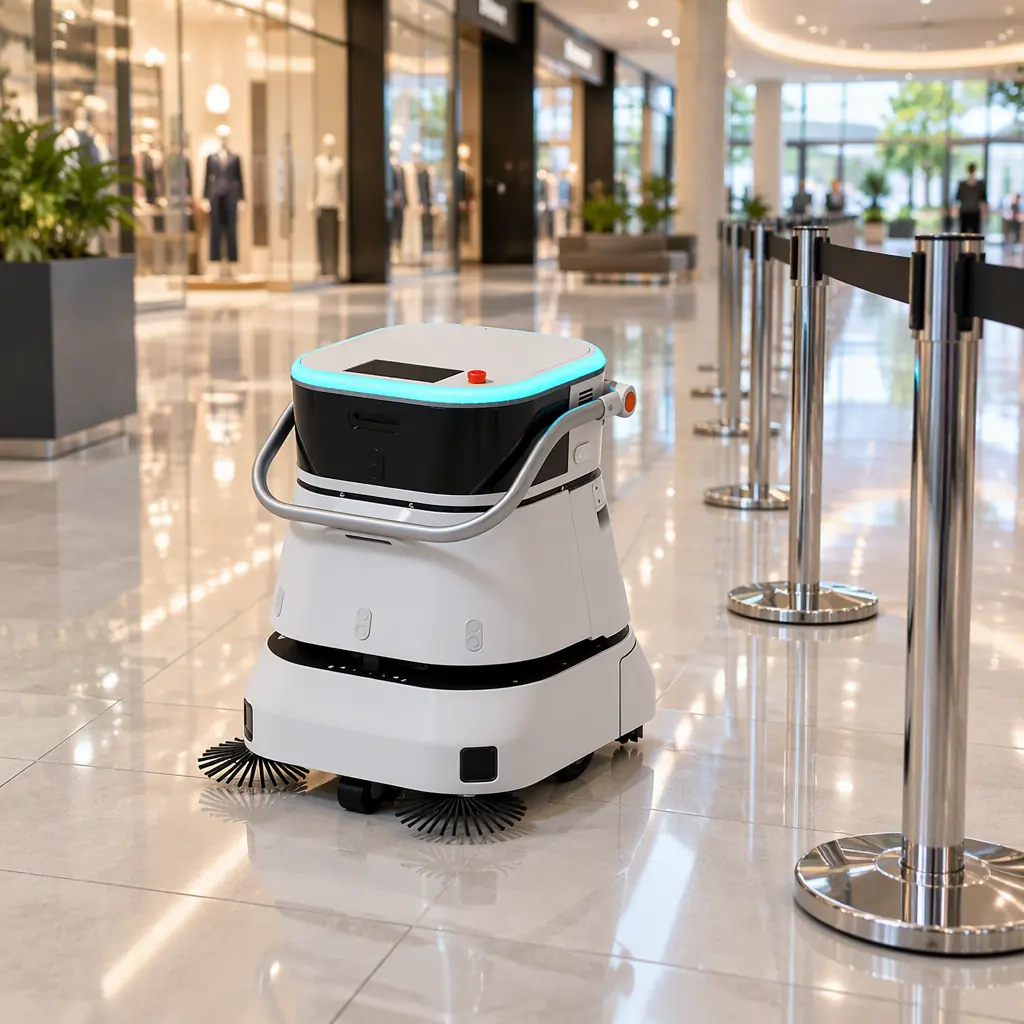
- Predictability beats speed. A robot that moves at a steady 0.5 m/s along a repeatable line is easier to walk around than one that accelerates hard and brakes late. Facilities report more complaints about unpredictable machines than slow ones.
- Yielding on the approach, not at the confrontation. Decelerating when a person enters the planned path 4 m ahead is read as courtesy. Stopping 0.3 m in front of someone is read as a near miss, even though the machine did nothing unsafe.
- Audible or visual intent. A short signal before reversing, a light strip showing the direction of travel, and a visible state on the screen reduce the number of interventions humans make. Interventions are the real throughput tax in public buildings, and they are not visible in any speed figure.
These behaviours are configurable on most platforms and are usually left at default. A commissioning conversation about approach distance, yield radius and signal timing is worth more to perceived performance than any change to cruise speed. The interaction design side of the same problem is covered in the pedestrian traffic management guide.
The Battery Cost of a Faster Profile
Speed is not free, and the cost lands on the pack rather than on the timetable. Traction energy rises roughly with the square of cruise speed on the same route, while the electronics and cleaning loads stay flat, so a profile change from 0.4 to 0.6 m/s on a scrubber typically adds 15 to 25 percent to motion energy and 6 to 10 percent to total draw. The sharper effect is on peaks: acceleration current scales with the acceleration setting, and a 0.9 m/s² ramp on a loaded scrubber can pull two to three times the cruise current for a second at a time. That pulse is what sizes the pack's continuous discharge rating and what shortens cycle life when it happens several hundred times a shift.
| Profile change | Effect on motion energy | Effect on peak current | Practical consequence |
|---|---|---|---|
| Cruise 0.4 to 0.6 m/s | Plus 15 to 25 percent | Unchanged | Shorter battery life per shift, or a slightly larger pack |
| Acceleration 0.5 to 0.9 m/s² | Plus 5 to 10 percent | Two to three times cruise current | Higher continuous discharge spec, more heat in the pack |
| More stop and resume cycles | Plus 8 to 15 percent | Repeated pulses | Cycle life consumed faster than calendar age suggests |
The trade is worth making deliberately rather than by default. A building that gains 40 seconds per route from a faster profile but loses thirty minutes of shift time to an extra charge is not faster overall, and the pack sizing that follows from a new profile belongs in the same conversation as the timetable. Pack sizing arithmetic and the charge-acceptance check are covered in the battery pack specification guide, and the duty-cycle effect on cycle life in the chemistry selection guide.
Comparing Two Robots in a Tender
The comparison below is the minimum evidence a buyer should require. Every row is measurable in a one-day trial on the buyer's own floor, and none of it requires access to the supplier's source code.
- Ask for cruise speed, acceleration and normal deceleration in SI units, and for the stopping distance at cruise on a named surface and load.
- Ask for the protective field dimensions and the reaction time, and check that the field covers the stopping distance plus a person's approach.
- Run a 30-minute coverage test on a representative route and divide distance by time. Compare against the brochure cruise speed, not against the other supplier's brochure.
- Place three unlisted obstacles and three people in the route and record stop distance, time to resume and any disengagement.
- Repeat the coverage test on a wet floor section and record both the speed cap and the stopping distance.
- Ask what happens when the localisation confidence drops, and watch the robot recover in a corridor with featureless walls.
A robot that scores well on all six is a robot whose 1.2 m/s means something. One that scores well on none of them may still be a reasonable machine, but the buyer now knows which number to believe.
How AOMAN Configures Motion Profiles
AOMAN's D1 delivery, C1 and C2 Pro cleaning and G1 reception platforms expose cruise speed, acceleration, deceleration, approach distance and yield radius as commissioning parameters rather than fixed firmware constants, so a profile can be tuned per site: a hospital ward corridor and an eighty-metre warehouse run are different operating envelopes on the same platform. Cleaning units carry a wet-floor mode with a reduced speed cap and an extended deceleration allowance, and delivery units can be set to a creep-on-approach behaviour for narrow service corridors. Platform details are on the products page, and the navigation and sensing architecture is described on the technology page.