
Service Robot Deployment Throughput Planning
At a glance: The question every buyer asks is how many robots they need, and the datasheet almost never answers it. The advertised figure is run time on a full battery, not square metres cleaned in a working shift. Between the two sit cleaning frequency requirements, obstacle density, dock-travel time and the difference between a sweeping pass and a scrubbing pass. This guide builds the coverage arithmetic from those variables, gives a defensible square-metres-per-shift number, and turns it into the unit count your building actually needs.
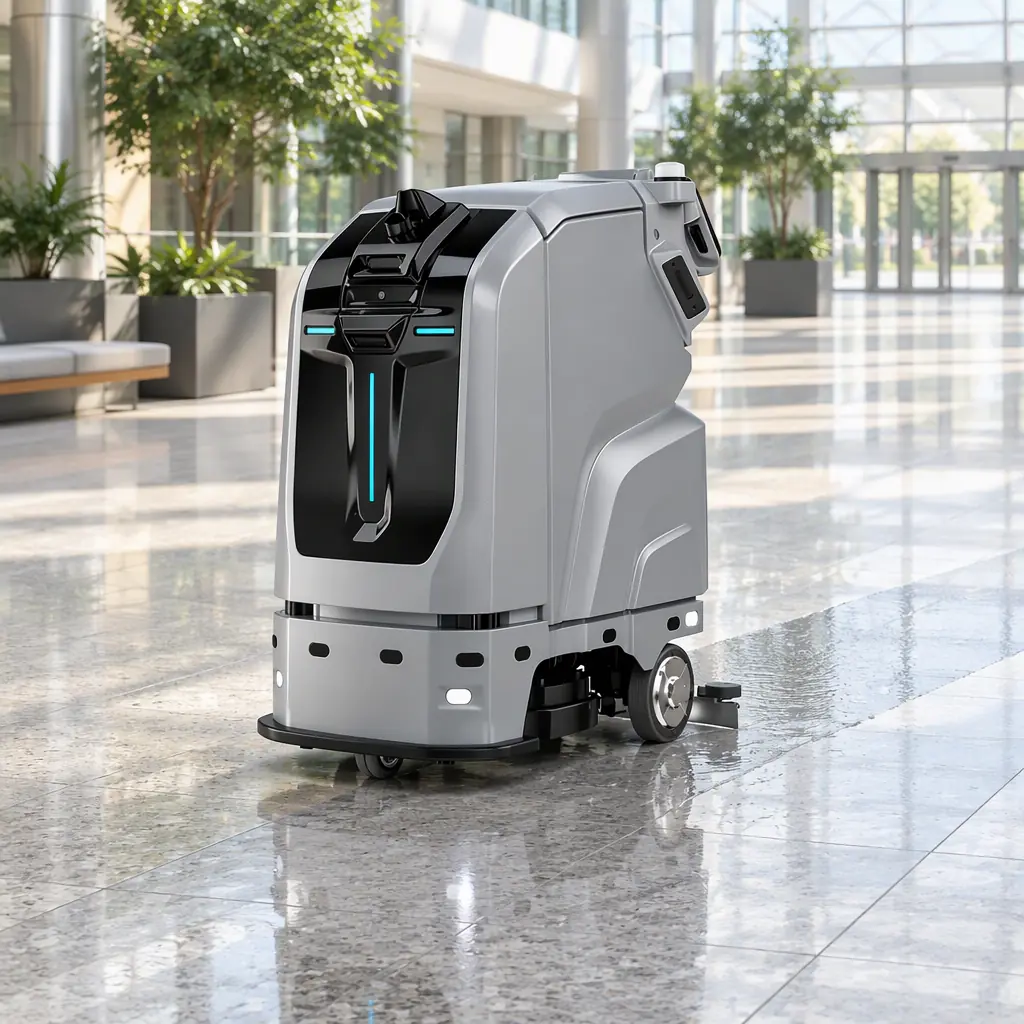
Datasheet Run Time Is Not Throughput
A specification sheet might state four hours of continuous operation. That number was measured on a smooth, empty floor at a fixed speed with no docking, no obstacle avoidance and no water refill. In a real building the same unit spends part of every hour navigating around people, slowing for congested zones, and returning to dock for water or charge. Throughput is what remains after those deductions.
Three multipliers separate run time from coverage:
- Effective working fraction. The share of shift time the unit is actually cleaning rather than travelling to dock, refilling, waiting at a lift, or paused by an obstruction. In our experience this sits between 0.55 and 0.75 in a well-planned building and below 0.5 in a congested one.
- Pass type. A sweep pass is faster than a scrub-and-recover pass. If the building needs scrubbing, coverage per hour drops because the unit moves slower and carries water.
- Obstacle density. The more freestanding items per 100 m², the more the route becomes a tight grid rather than long sweeps, and the lower the coverage rate.
Sizing a fleet off the headline number overstates capacity and leaves a building permanently behind schedule. The rest of this guide replaces the headline with arithmetic you can stand behind.
The Coverage Arithmetic
Start with the base cleaning rate, which is the manufacturer's wet coverage figure for the relevant pass type — typically expressed in square metres per hour. Then apply the deductions in order:
| Variable | Symbol | Typical value | Effect |
|---|---|---|---|
| Base cleaning rate | R | 2,000-3,500 m²/h (scrub) | Datasheet figure for the pass type |
| Effective working fraction | F | 0.55-0.75 | Multiplies R directly |
| Obstacle factor | O | 0.85-0.95 | Drops as furniture density rises |
| Shift length | S | 6-8 h of robot availability | Excludes charging and human handover |
Effective coverage per shift is therefore:
Coverage = R × F × O × S
Worked example. A scrubber with a base rate of 2,600 m²/h, an effective working fraction of 0.65, an obstacle factor of 0.90 and a seven-hour available window gives 2,600 × 0.65 × 0.90 × 7 = 10,647 m² per shift. Compare that to the naive 2,600 × 7 = 18,200 m² the datasheet implies. The gap is roughly 40%, and it is the gap that decides how many units you order.
If those deductions feel aggressive, test them on your own site rather than taking ours on faith. A one-week instrumented pilot produces the real F and O values, and the way to structure that pilot so the numbers mean something is set out in the pilot programme guide.
Frequency, Not Just Area
Coverage per shift answers how much floor one unit can reach. It does not answer how often that floor must be reached. Cleaning frequency converts area into demand:
| Zone type | Typical frequency | Weekly demand per 1,000 m² |
|---|---|---|
| Public lobby and entrances | 2-3× daily | 14,000-21,000 m²/week |
| Office floors | 1× daily on weekdays | 5,000 m²/week |
| Restrooms and food areas | 3-4× daily | 21,000-28,000 m²/week |
| Back-of-house corridors | 2-3× weekly | 2,000-3,000 m²/week |
| Car parks and service yards | 1× weekly | 1,000 m²/week |
Multiply each zone's area by its weekly demand factor, sum across the building, and you get total weekly coverage demand in square metres. Divide that by the per-unit weekly capacity (coverage per shift × shifts per week) and round up. That is your unit count before redundancy.
High-frequency zones are the ones that surprise buyers. Restrooms and food-service areas may be a small share of floor area but a large share of demand, and they are also the zones where a robot's speed advantage matters least because of clutter and footfall. Weight them accordingly rather than treating the building as one uniform surface.
From Coverage to Unit Count
With weekly demand and per-unit capacity in hand, the calculation is a division, but three adjustments decide whether the answer survives contact with reality.
- Availability, not perfection. No fleet runs at 100%. A unit in scheduled maintenance, on a firmware update, or simply unavailable for a day is capacity you cannot count on. Plan the fleet at 85-90% availability and hold the balance as the buffer that the spare-unit plan formalises — see staging depot and spare-unit planning.
- Dock and travel overhead. The more dispersed the building, the more shift time is lost travelling to the dock. A building with one dock in a far corner effectively loses capacity on every outlying zone. Consider a satellite dock if travel exceeds about 15% of shift time.
- Shift structure. Two shorter shifts can beat one long one because charging fits inside the gaps, but only if a human is present to hand over. An unattended night shift with auto-docking can extract more working time but needs the safety and access review completed first; the interface checklist is in the network and connectivity guide and the site gate in the site survey readiness assessment.
Worked continuation: if weekly demand is 96,000 m² and one unit covers 10,647 m² per shift over five night shifts (53,235 m²/week), you need 96,000 ÷ 53,235 = 1.8, so two units — plus a buffer if availability is below 90%. Two units at 100% availability have no room for a maintenance day; the honest answer for a critical building is often three, with one covering the outage.
Sanity-Checking the Result
A calculated unit count is a hypothesis until it survives three checks. First, does it match the shape of the building — long sweeps need fewer units than a fragmented plan? Second, does the fleet fit the dock and charging provision you surveyed, or does adding the third unit require an electrical upgrade? Third, does the coverage rate hold in the busiest hour, not just on average? A fleet that only works when the building is empty is not a fleet that works.
Finally, revisit the numbers at six months. Obstacle density changes as tenants move furniture, frequency requirements change as occupancy shifts, and firmware updates move the effective working fraction. Throughput planning is not a one-off calculation; it is the baseline against which you judge whether the fleet is still right-sized. The utilisation metric that keeps it honest is covered in the fleet utilisation rate benchmark.
Continue Reading
Get a Quote
Tell us about your site and workload and we will size the fleet, the accessories and the service plan around your actual operation. Request a quote or email [email protected].

Get a Quote
Tell us about your space and workload, we reply within 24 hours.