Shelf Scanning Robots vs Electronic Shelf Labels: Which Job Each Solves
At a glance: Most retailers that buy shelf-scanning robots have already deployed electronic shelf labels, and most discover afterwards that the two systems overlap in the narrowest possible way. This article separates the four jobs a store needs done, sets out the measured accuracy of each technology against each job, and then runs the capital and subscription arithmetic for a 25-store network so the decision is a coverage plan rather than a product preference.
Four Jobs That Get Confused
Electronic shelf labels and inventory robots are frequently evaluated as alternative answers to the same question. They are not. The store has four distinct jobs, and each technology reaches only some of them.
| Job | What it means operationally | ESL reaches it | Robot reaches it |
|---|---|---|---|
| Price display | The shelf shows the correct price to the shopper | Yes, directly | No, it only observes |
| Price integrity audit | Displayed price matches point of sale for every facing | Yes, if POS is the single source | Yes, independently verified |
| On-shelf availability | A product is where the planogram says it should be | No | Yes, the core use case |
| Planogram compliance | Facings, facings per SKU, and position match the layout | Partly, position only | Yes, position and presence |
| Recall and date-code sweep | Specific batches are located and pulled | Only if barcode-coded | Yes, by scan |
The confusion arises because an ESL deployment genuinely eliminates one class of problem, the mis-priced shelf, and the vendor's case study then implies the store no longer needs to audit price at all. That holds only while the POS-to-label link is intact. Where labels are updated by batch overnight while price changes are authorised during the day, the ESL and the till still disagree for several hours, and nothing detects it unless something reads the shelf.
The inventory job is a separate matter. An ESL has no idea whether the facing behind it is stocked, and no ESL deployment in service today tells a store manager that a promotion is eighty percent sold out at 2pm on a Saturday.
Accuracy, Task by Task
Published accuracy claims are not comparable across technologies because they measure different things. The table below uses the definitions a store operations team would apply, with the range observed across deployments rather than a single vendor figure.
| Measurement | ESL network | Shelf-scanning robot | Manual audit |
|---|---|---|---|
| Price displayed correctly | 99.4 to 99.9 percent while in sync | Detects the exceptions, does not fix them | 95 to 98 percent |
| Detection of a wrong price | None if the link is the source of truth | 94 to 98 percent per pass | Depends on sampling, typically 40 to 60 percent |
| On-shelf availability detection | Not applicable | 90 to 96 percent, lower in crowded categories | 60 to 75 percent, and only where staff look |
| Planogram position compliance | Label position only | 85 to 93 percent at SKU level | Highly variable |
| Audit frequency achievable | Continuous for price | 2 to 5 passes per store per week | 1 per quarter at most |
| Cost per store per year | Label capex plus gateway and battery | Subscription or capital plus service | Store labour hours |
Two readings of this table matter. First, the robot is not more accurate than an ESL at knowing the right price, because the ESL does not need to measure anything; it displays whatever the system tells it. Second, the robot is the only one of the three that produces an independent, dated record of what was on the shelf, and that record is what makes the availability and compliance jobs measurable at all.
Accuracy also degrades differently. ESL accuracy depends on link integrity and label battery health, both of which fail quietly at scale. Robot accuracy depends on lighting, shelf density and occlusion, and it degrades in specific known conditions such as deep promotional bins and end caps with stacked product.
The Capital and Subscription Arithmetic
The comparison only becomes a decision when it is run on a concrete network. The model below assumes 25 stores, an average of 4,500 SKUs per store, and a mix of 18 large-format and 7 small-format sites. All figures are planning estimates and should be replaced with quoted prices before approval.
| Line | ESL network, 25 stores | Shelf-scan robot programme, 25 stores |
|---|---|---|
| Hardware | 112,500 labels at USD 6.50 = 731,250 | 18 large stores at 1 unit, 7 small at 1 shared unit = 25 units |
| Unit price | Included above | USD 21,000 per unit including dock and software |
| Network and gateway | USD 2,800 per store = 70,000 | Wi-Fi survey and AP works, USD 1,200 per store = 30,000 |
| Installation labour | USD 4,200 per store = 105,000 | Commissioning included in unit price |
| Year 1 total | 906,250 | 555,000 |
| Annual running, years 2 to 5 | Battery and gateway support, USD 1,900 per store = 47,500 | Service at 9 percent of hardware = 47,250 |
| Five-year total | 1,096,250 | 744,000 |
| Annual cost per store | 8,770 | 5,952 |
On capital alone the robot programme is the cheaper of the two across a 25-store network, which is not the answer most operators expect. The reason is that ESL cost scales with the SKU count, roughly 112,500 labels in this model, while robot cost scales with store count. A network with 8,000 SKUs per store reverses the ranking: ESL cost roughly doubles while the robot fleet is unchanged.
That single relationship is the most useful output of this exercise. ESL economics are driven by SKU density; robot economics are driven by store count and floorspace. A convenience format with 2,400 SKUs and a small footprint should lean on labels. A hypermarket with 30,000 SKUs should not treat labels as the answer to availability at all.
What the Robot Adds That Labels Cannot
The availability job has a revenue mechanism that is worth stating precisely, because it is usually quoted as a percentage range without arithmetic. The standard framing is that one to four percent of sales are lost to items that are out of stock but still listed as in stock, and that shoppers substitute or leave.
Worked on a single large store doing USD 18 million a year, a two percent recoverable share is USD 360,000 of sales. At a 26 percent gross margin that is USD 93,600 of gross profit, against an annual robot cost of about USD 7,000 at the figures above. The ratio is large enough that even a tenth of the assumption pays for the programme, which is why the modelling discipline matters more than the headline: the recoverable share must be the share the store can actually close, meaning the shelf gap is fillable from the back room within the same trading day.
| Availability outcome | Typical recoverable share | Mechanism |
|---|---|---|
| Gap with stock in the back room | 50 to 70 percent of detected gaps | Task generated to the right aisle, filled same day |
| Gap with no stock on site | 0 percent from the robot alone | Feeds replenishment forecasting, not recovery |
| Wrong facing, product present | 80 to 90 percent | Corrected on the next pass |
| Promotion sold out early | Depends on supply | Detected hours earlier than a manual walk |
| Recall still on shelf | 100 percent of detected units | Compliance exposure, not revenue |
There is also an audit trail argument that matters to larger networks. Because the robot produces a dated per-facing record, the availability figure in the monthly operations pack stops being an estimate from a sample walk and becomes a measured census. Retailers who have run both report that the biggest change is not the detection rate but the end of arguments about whether a store was in compliance on a given day.
Running Both Without Double Paying
The sensible end state for most networks is both technologies, with a clear division of labour and an explicit rule about what the robot is not asked to do.
| Responsibility | Assigned to | Rationale |
|---|---|---|
| Price shown to shopper | ESL | It is a display device; use it as one |
| Price-to-POS validation | Robot, sampled weekly | Independent check on link integrity |
| Availability detection | Robot | Labels cannot see stock |
| Replenishment task generation | Robot software into task system | Avoid a second work queue |
| Date-code sweep | Robot, on a scheduled pass | Consistent coverage, dated record |
| Promotional end-cap audit | Robot where reachable, manual otherwise | Camera limits on deep bins |
Three integration points do most of the work. The robot's task output should land in the same queue the store already uses for replenishment, or the store will run two lists and complete neither. The price exception list should route to whoever owns the price file, not to the store manager, because the store cannot fix a POS error. And the availability data should feed the replenishment forecast, not just the daily task list, or the same SKUs will show as gaps every week.
The double-payment trap is subtler than duplicate hardware. It is the store that buys labels to solve price, then buys a robot to solve availability, then asks the robot to do a price audit that the labels already guarantee, and finally pays for a nightly manual walk because nobody trusts either system's data. The fix is procedural: one owner per job, one task queue, and a stated audit frequency for each.
Rolling Out Across 25 Stores
Networks that deploy the whole estate at once tend to discover the integration problems twenty-five times simultaneously. A staged rollout over three quarters costs the same in hardware but surfaces the process issues on one store.
| Phase | Stores | What is being proven | Exit criterion |
|---|---|---|---|
| Pilot | 2, one large one small | Route coverage, dock siting, Wi-Fi | Full-store map in under 6 hours |
| Measurement | Same 2, 90 days | Detection accuracy against manual audit | Within 5 points of vendor claim |
| Integration | Same 2 | Task queue and forecast feed | Tasks closed same day above 70 percent |
| Wave 1 | 6 | Operational load on store teams | No additional hours rostered |
| Wave 2 | 10 | Service and spares logistics | Under 2 percent downtime |
| Wave 3 | 7 | Steady state | Fleet dashboard covers all sites |
Two practical constraints shape the schedule. Store mapping takes a supervised first pass of three to six hours per store, and stores with seasonal layout changes will need re-mapping when the layout changes materially. Dock siting usually lands in the back-of-store corridor, and the constraint is power rather than space. Both are worth resolving in the pilot rather than in wave three.
For networks where the same estate also runs cleaning robots, the survey and network works can be shared, and the multisite deployment sequencing published by AOMAN sets out how to sequence the two programmes through the same store calendar. Stores that are formats of the same banner can also reuse planogram definitions across sites, which shortens mapping considerably.
When the Robot Is the Wrong Purchase
The case above assumes a store with a stable planogram, workable aisle widths and a task system that can absorb new work. Four conditions make the shelf-scanning robot a poor investment, and they are worth checking before any pilot is approved.
- High SKU churn with weekly layout resets. Re-mapping cost can exceed the availability gain, and the record goes stale between passes. Retailers with frequent promotional resets should either map against the base planogram only or wait.
- Narrow aisles with dense promotional clutter. Detection rates fall sharply where product overhangs the shelf edge and where pallet displays block the aisle. Measure the detection rate in the actual cluster before committing.
- No owner for the task output. If nobody closes the replenishment tasks the robot generates, the store pays for detection and gets no recovery. The programme must have an operations owner, not just a technology sponsor.
- Very low SKU density. Below roughly 3,000 SKUs per store with high staff presence, manual walks plus price labelling may be adequate and the robot's value is primarily the audit record, which is a compliance purchase rather than a revenue one.
The mirror case is just as important. A label-only strategy stops at price. If the store's actual loss is driven by availability, labels deliver a clean price file and no improvement in the shelf gap, and the operations team will spend the next two years manually auditing a problem the label network was never designed to see.
The decision rule in one line: assign each job to the instrument that can actually measure it, label the price, send the robot to look at the shelf, put both outputs into one task queue, and measure the recoverable share on your own estate before scaling beyond the pilot.

Frequently Asked Questions
Do I still need shelf-scanning robots if I have electronic shelf labels?
Yes, if on-shelf availability or planogram compliance matters to your sales. Electronic shelf labels show the price the system sends them; they cannot detect that a facing is empty, misplaced or occupied by the wrong SKU. The robot covers the shelf-state jobs, the labels cover the display job.
How accurate are inventory robots in large-format grocery stores?
Between 90 and 96 percent detection on on-shelf availability, and 85 to 93 percent on planogram position at SKU level, with lower rates in deep promotional bins and where product overhangs the shelf edge. Accuracy is best validated by running the robot and a manual audit on the same aisles for two weeks.
Which is cheaper across a 25-store network, labels or robots?
It depends on SKU density more than store count. At 4,500 SKUs and 25 stores, labels cost about USD 1.1 million over five years and a single-unit-per-store robot programme about USD 750,000. At 8,000 SKUs per store the ranking reverses, because label cost scales with SKUs while robot cost scales with stores.
What is a realistic out-of-stock recovery rate?
Between 50 and 70 percent of detected shelf gaps are fillable from back-room stock during the same trading day. Gaps with no on-site stock are not recovered by the robot; they feed replenishment forecasting instead.
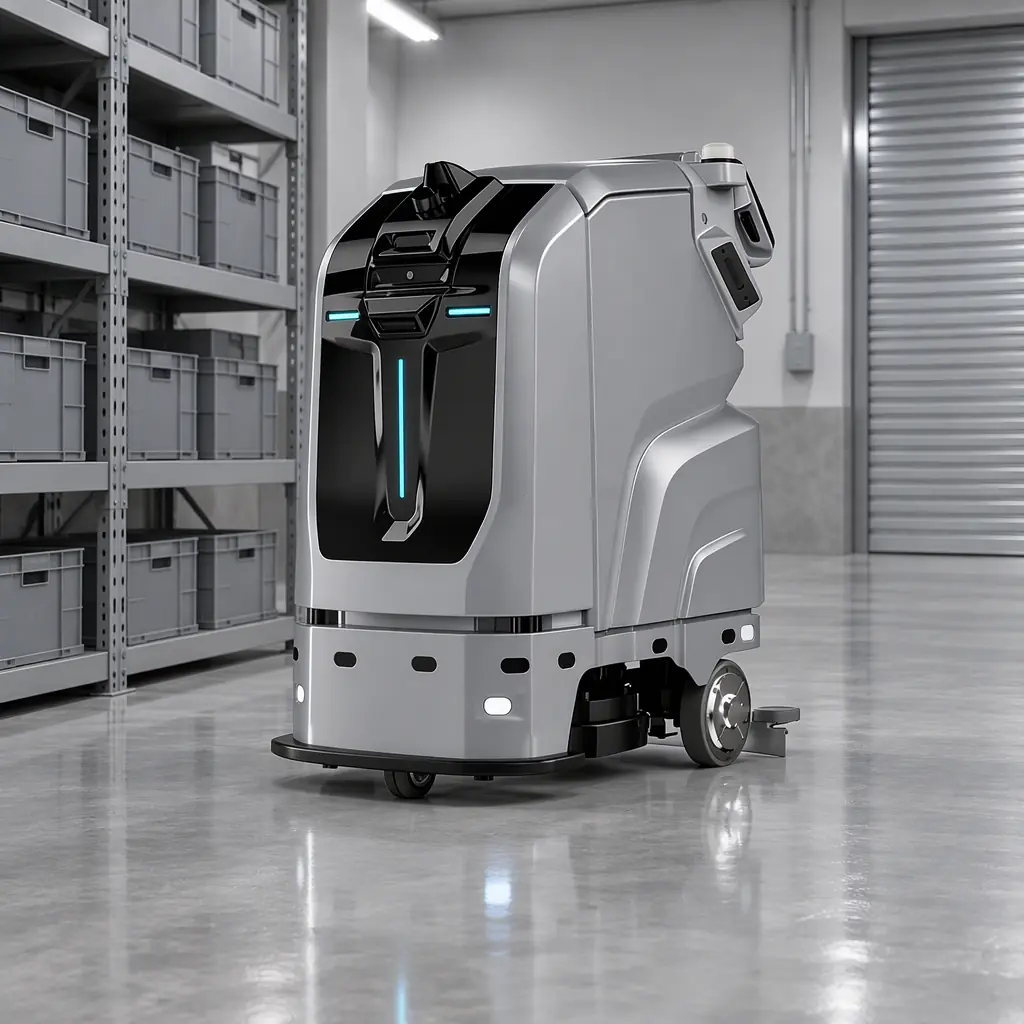
The platform used in the arithmetic above is described on the AOMAN D1 delivery robot product page, which also lists the sensor set that determines detection accuracy at shelf height.