
On-Shelf Availability Robots in Retail
At a glance: Empty shelf space is the most expensive space in a supermarket. A shopper who cannot find the item leaves without it, and the store loses not only that sale but the basket around it. Shelf-scanning robots turn out-of-stock detection from a manual spot-check into a measured, daily process, and they do the same for price-tag errors and planogram drift. This guide covers how the scan works, the accuracy and cadence a store should expect, and the arithmetic that decides whether a scanning fleet pays for itself.
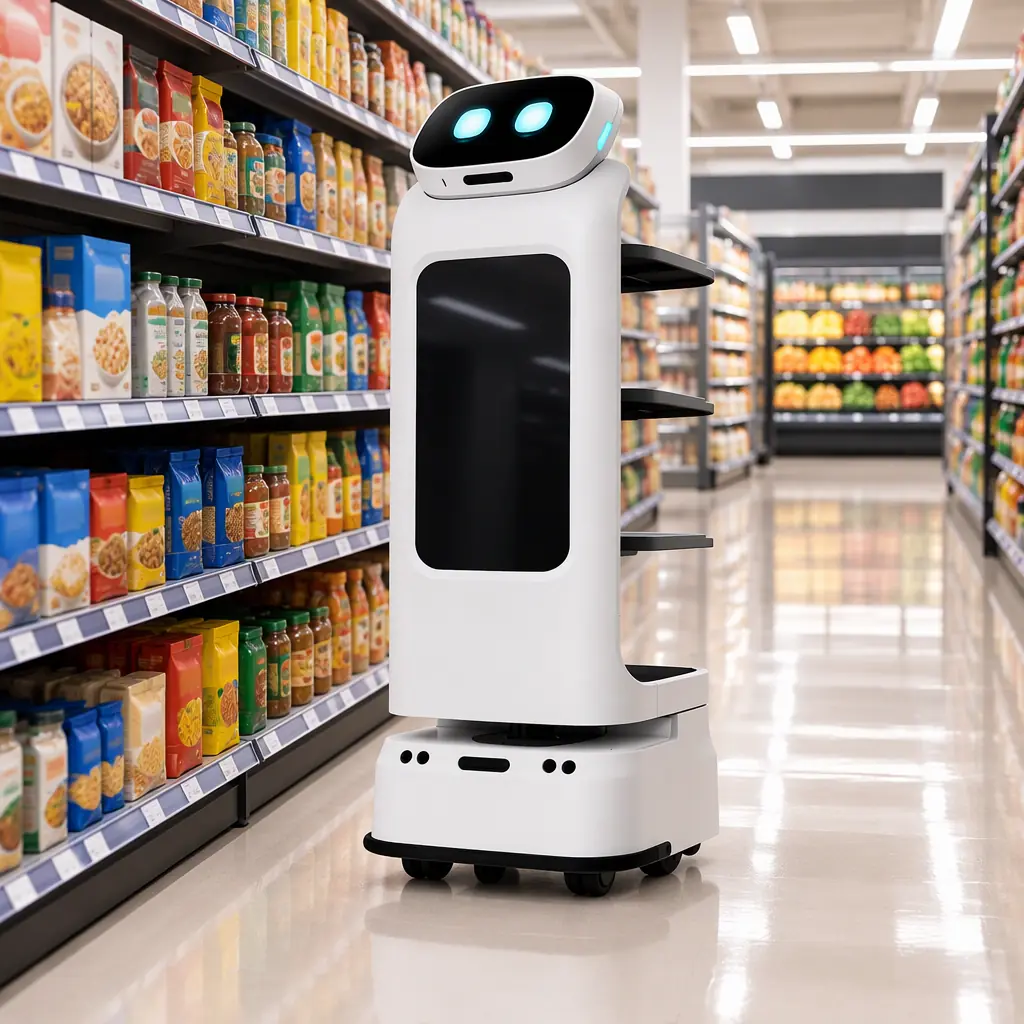
What an On-Shelf Availability Robot Does
An on-shelf availability robot is a mobile unit that carries cameras and drives the aisles on a fixed route, capturing the state of every shelf it passes. Where a delivery robot moves goods and a cleaning robot moves water, a scanning robot moves a camera, and its output is a data set: which facings are empty, which price tags disagree with the point-of-sale system, and which products are sitting outside their assigned planogram position.
The unit is usually built on the same chassis as a delivery or guidance robot, with the camera mast replacing the tray or the screen. That reuse is why scanning deployments in 2026 pair naturally with an existing fleet: the navigation, the mapping and the charge docks are shared with the robots already on the floor, as set out in the fleet management guide. What is new is the measurement layer, and the measurement layer is the entire value proposition.
The three outputs map to three losses the store already tracks. Out-of-stock (OOS) detection addresses lost sales. Price-tag error detection addresses checkout disputes and legal price-accuracy risk. Planogram compliance addresses the promotional execution that suppliers pay for and rarely verify. A store that scans for all three turns a recurring manual audit into a daily automated one.
How the Scan Detects Out-of-Stock and Price Errors
The detection pipeline has three stages, and understanding them is what lets a buyer judge a vendor's accuracy claim instead of taking it on trust. The first stage is localisation: the robot must know, within a few centimetres, which bay and which shelf height it is photographing, because a detection attached to the wrong shelf position is worse than no detection. This comes from the same mapping layer the rest of the fleet uses, refined by shelf-level fiducials or a tight bay map.
The second stage is recognition: for each facing, the system reads the price tag, matches the product to the planogram, and classifies the shelf gap as empty, mis-stocked, or a genuine facings gap. Modern vision models handle the tag OCR and the product match, but the accuracy is bounded by the shelf imagery, not the model, so lighting and camera angle set the ceiling. The third stage is reconciliation: the detection is matched against the store's inventory and planogram data, and only the genuine exceptions are raised as tasks. A pipeline that skips this stage floods the store with false alarms and gets switched off within a month.
| Stage | What it produces | The accuracy bottleneck |
|---|---|---|
| Localisation | Bay and shelf position for every frame | Map precision at shelf height |
| Recognition | Empty/full facing call, tag read, product match | Image lighting and camera angle |
| Reconciliation | A short list of genuine exceptions | Quality of the store's planogram data |
The reconciliation stage deserves special attention, because it is the stage the store controls. A robot scanning against a planogram that is three weeks out of date will report phantom OOS and phantom misplacements all day. The prerequisite for any scanning deployment is a clean, current planogram, which is why the deployment checklist puts the planogram ahead of the hardware. The work of getting the store's data ready follows the same readiness discipline as the site survey and readiness assessment.
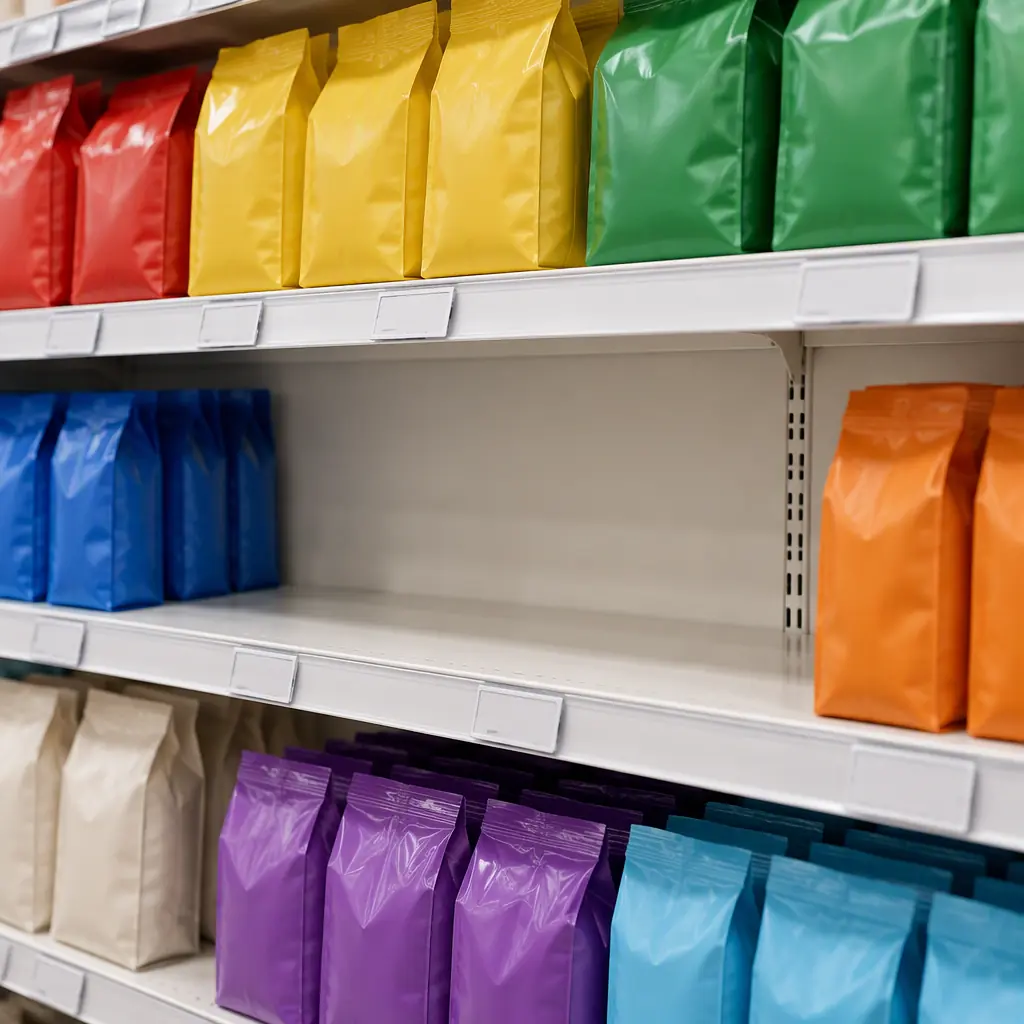
Scan Cadence and Accuracy Arithmetic
The value of a scanning fleet is set by two variables: how often the shelves are scanned, and how accurate each scan is. Both are quantifiable, and a store should ask for both numbers in writing before a pilot.
Cadence is a coverage problem. A supermarket of 2,000 square metres of selling floor might have 1.5 to 2.5 kilometres of shelf frontage. A single robot travelling a scan route at roughly 1 metre per second, spending part of its time stopped for clear imagery, can cover a defined zone in a shift. Scanning the whole store daily usually requires more than one unit, or a schedule where high-velocity aisles are scanned every day and slow categories twice a week. The arithmetic is the same coverage calculation used for any fleet task, treated in deployment throughput planning.
Accuracy is a precision-and-recall problem, and the store should insist on both figures. Precision is the share of the robot's reported OOS events that are genuinely out of stock; a low precision means staff are walking to shelves that are fine. Recall is the share of real OOS events the robot catches; a low recall means the store misses the very losses it bought the robot to find. A vendor that quotes a single "accuracy" number is hiding which of the two it is.
| Metric | Target range | Why it matters |
|---|---|---|
| OOS detection precision | 85 to 95 percent | Low precision wastes staff re-fill trips |
| OOS detection recall | 85 to 95 percent | Low recall leaves sales on the floor |
| Price-tag read accuracy | 97 percent and above | Tag errors carry legal price-accuracy risk |
| Full-store scan cadence | Daily to twice weekly by zone | Cadence sets how fast the gap is closed |
| Exception list size per scan | 50 to 300 genuine tasks | Oversized lists get ignored by staff |
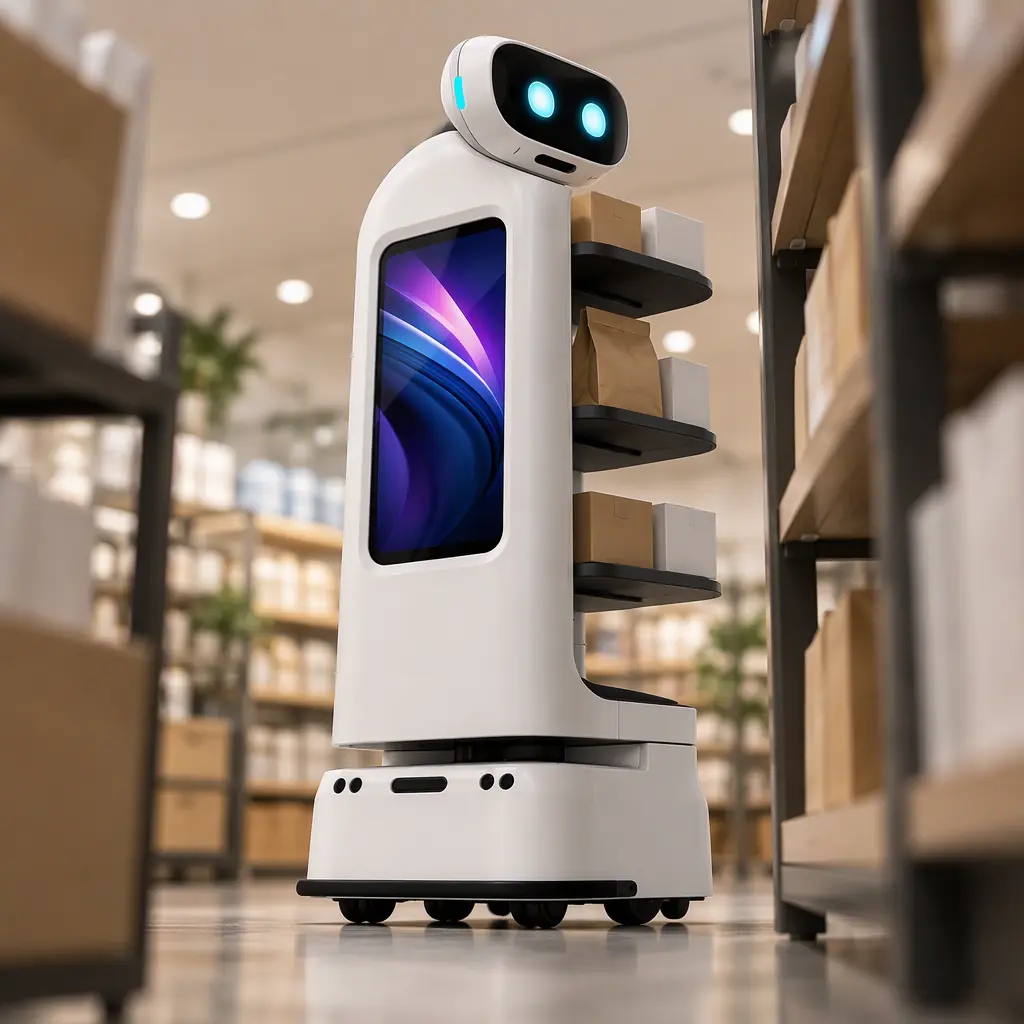
The Business Case: Lost Sales Versus Fleet Cost
The business case for a scanning fleet is built on the value of the OOS events it closes, and that value is larger than most store managers expect because of the substitution effect. The lost sale is not just the missing item; a shopper who cannot complete a planned basket often abandons adjacent items, so the lost margin on one OOS facing can run several times the item's own gross profit.
The comparison is therefore the annualised margin recovered from faster OOS closure plus the price-error disputes avoided, against the fleet's annual cost of ownership. Three inputs drive the recovered-margin figure: the number of OOS events detected per week, the share that the store can actually re-fill from backstock, and the average basket margin attached to a recovered item. A store that runs the arithmetic honestly often finds the fleet pays back within the first year in high-velocity categories alone, and the price-accuracy benefit is upside. The full cost side of the ledger, including the pack and service costs a scanning fleet shares with any other robot, follows the total cost of ownership model, and the payback framing is the same as the payback period calculation.
One honest caveat belongs in every proposal: the recovered margin is only realised if the store closes the gaps the robot finds. A scanning fleet that produces an exception list nobody acts on saves nothing, and the deployment then fails on staffing, not on technology. The pilot should therefore measure closure rate, not detection count.
The Planogram Compliance Workflow
Planogram compliance is the third output and the one suppliers care about most, because a promotional display that is not set correctly is money the supplier paid and did not receive. The robot turns compliance from an occasional audit into a continuous measurement.
The workflow has four steps. First, load the current planogram into the scanning system, because the comparison is only as good as the reference. Second, scan the bay and classify each facing as compliant, missing, or misplaced. Third, generate a task for the store team with the bay and the specific discrepancy, so the fix is a targeted action and not a shelf re-check. Fourth, record the correction time, which becomes the compliance metric reported back to the supplier. That last step is what turns the scan into a commercial asset: a supplier shown a dated before-and-after of their own display is far more likely to fund the next promotion. The same prove-the-work discipline used in the guide to measuring productivity before you automate applies here, with shelf compliance as the measured output instead of clean floor area.
The workflow also reveals a staffing truth. The robot does not fix shelves; staff do. A compliance programme only works when the exception list is short enough to be actioned in a normal shift, which is why the reconciliation stage that filters false alarms is not a luxury but the thing that keeps the programme alive.
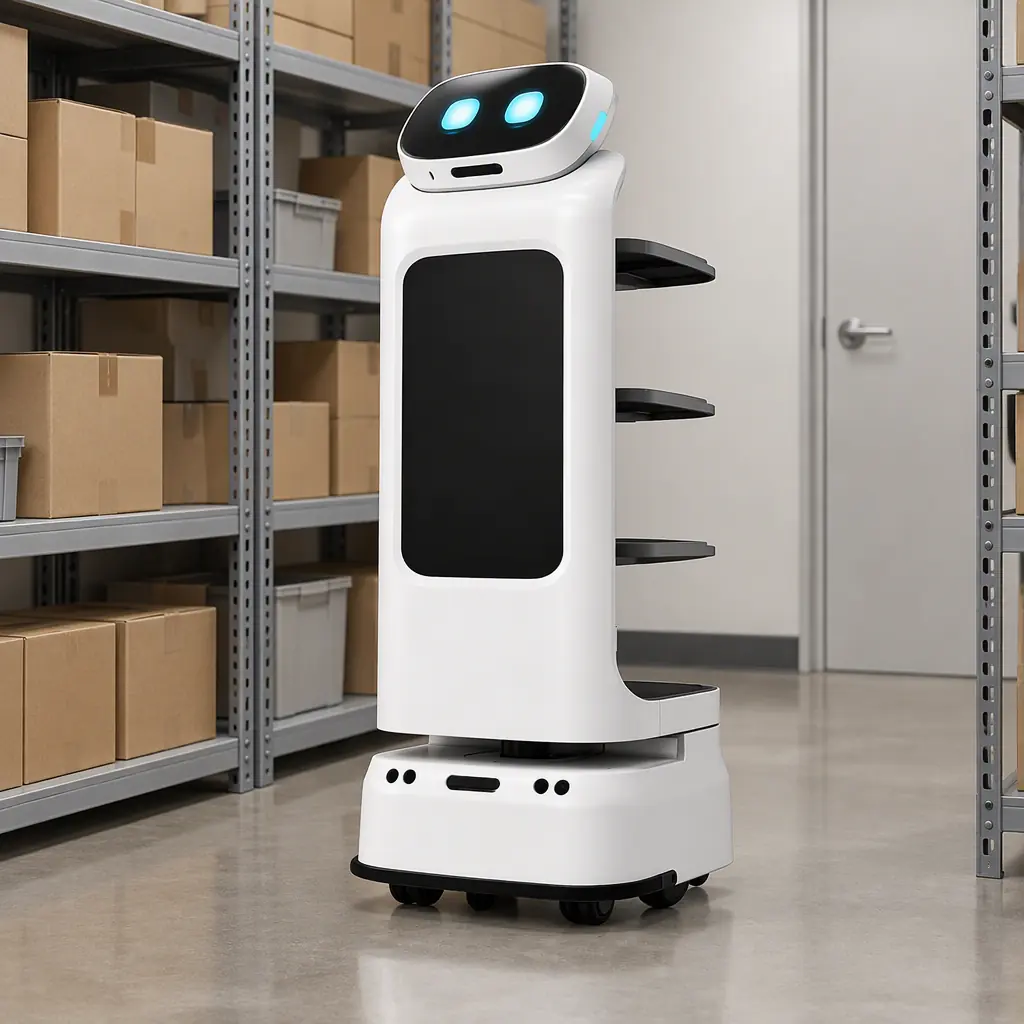
Building the Case for a Scanning Fleet
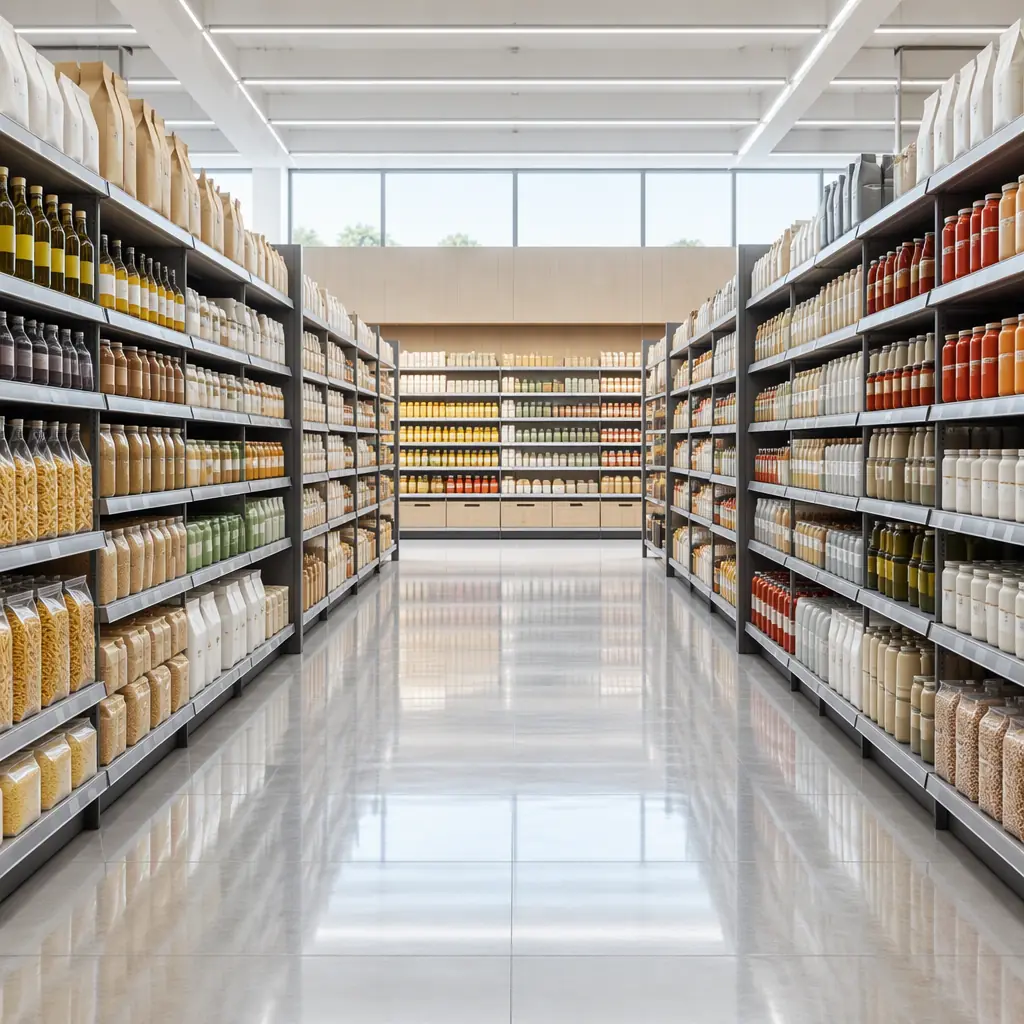
A store should treat shelf-scanning as a measurement deployment, not a robot purchase. Four conditions decide whether it works. The planogram data must be current before the first scan. The vendor must quote precision and recall separately and commit to the counting method. The exception list must be small enough to action within a shift. And the store must measure closure rate as the success metric, because detection without closure recovers nothing. When those four hold, the scanning fleet turns three losses the store already tracks into three measurable, daily processes, and the business case follows from the measurement rather than from the hardware.
Get a Quote
Tell us about your space and workload, we reply within 24 hours.