
Grocery & Superstore Robots: A Store-Level Fleet and ROI Model
At a glance: Groceries are where robot ROI is easiest to justify and hardest to model. The store has fixed geometry, predictable trading hours and a known labour rate, so a fleet count and a cash model can be derived from numbers the operator already holds. This guide does that arithmetic in the open: aisles to units, units to shifts, shifts to a five-year per-store ledger.
Why Grocery Is Different From General Retail
A general retailer can change its floor plan when it wants. A grocery store generally cannot. The aisle grid is driven by cold-chain run lengths, and those are driven by the dairy, chiller and freezer walls, which are driven by the building services. That constraint is usually treated as a limitation for automation, but it is the opposite. A fixed, high-frequency, tightly repeated floor plan is exactly the environment where a robot's return can be calculated in advance rather than measured after the fact. Grocery is also a three-duty environment: the shelves need scanning, the floor needs cleaning and the perimeter has advertising value. Very few other retail formats carry all three revenue-relevant robot jobs in one building.
The consequence is that a grocery robot business case is not a technology decision, it is an arithmetic one. Every input a manager needs, aisle count, trading hours, floor area, labour rate, shrink rate, is already in the store's own systems. That is unusual. In most retail automation, the inputs have to be estimated; in grocery, they can be read out of the estate management database. For a wider view of where robots fit across retail formats, see the commercial cleaning robot buyer's guide.
Sizing the Fleet From Store Geometry
Two duties dominate the sizing calculation: shelf scanning and floor cleaning. Advertising robots follow the footfall path and are sized by traffic, not by geometry, and are covered in retail advertising robots for supermarkets.
Shelf scanning is bounded by traverse length. A shelf-scanning unit travels one pass per aisle face. Take the store's total linear aisle metres, double it (two faces per aisle), and you have the scanning load per full sweep. A mid-size supermarket runs roughly 800 to 1,200 linear metres of shelving, so a full sweep is 1,600 to 2,400 metres of travel. At a scanning speed of 0.8 to 1.0 metres per second the sweep itself takes about 30 to 45 minutes, but the camera pipeline, exception review and dwell time at end caps add 50 to 100 percent. Plan a realistic 60 to 90 minutes per full sweep.
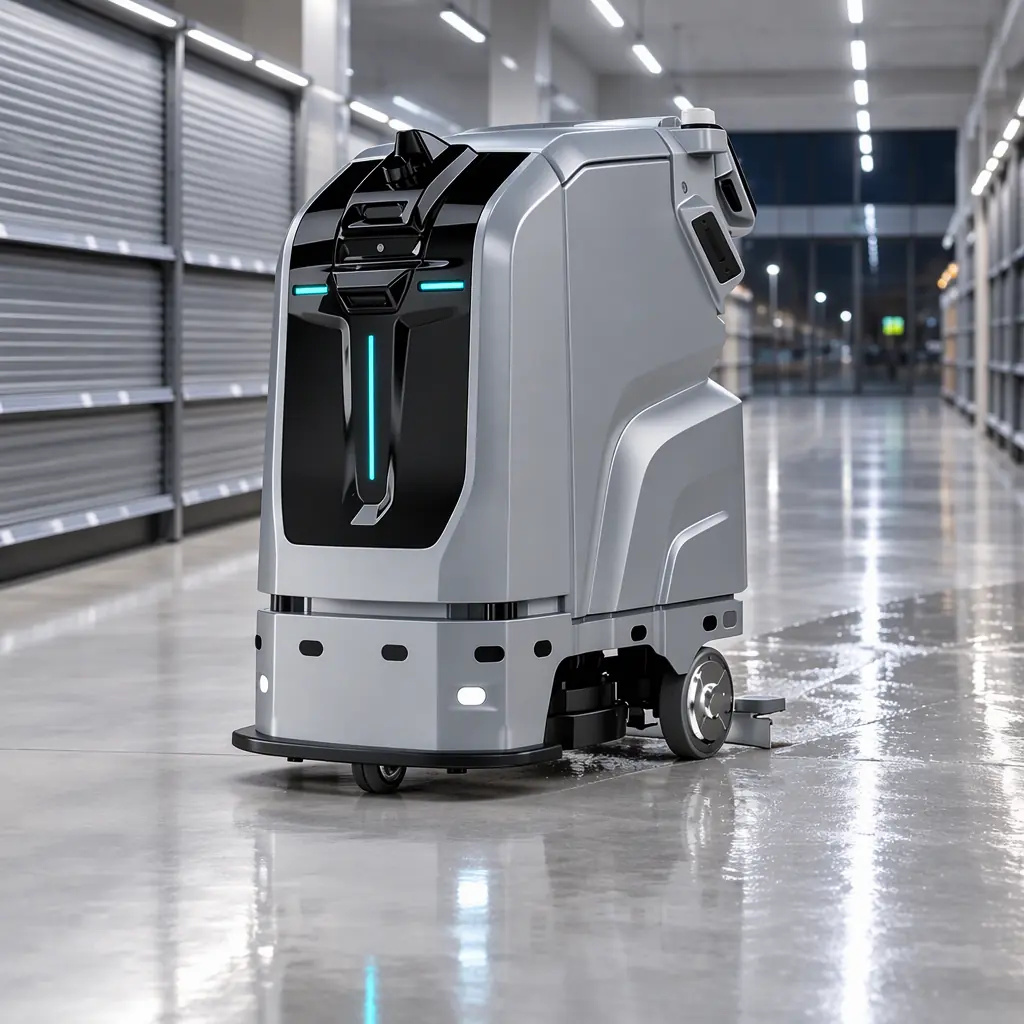
Cleaning is bounded by floor area and squeegee width. A 25-centimetre squeegee covering a 4,000 square metre floor needs 16,000 linear metres of travel; a 65-centimetre scrubber needs about 6,200. At a working speed of 0.6 metres per second, that is roughly 7.4 hours versus 2.9 hours of actual scrubbing, before water stops, dock returns and obstacle avoidance. The cleaner is the larger duty in most grocery stores, which is why cleaning robots are usually the first unit a store deploys.
| Duty | Sizing input | Typical grocery figure | Implication |
|---|---|---|---|
| Shelf scan | Linear aisle metres x 2 | 1,600-2,400 m/sweep | 1 unit per 60-90 min sweep window |
| Floor cleaning | Floor area / squeegee width | 6,200-16,000 m/pass | 1 unit can be the limiting resource |
| Advertising / media | Footfall path length | Traffic-dependent | Sized by impressions, not metres |
Three Robot Jobs, Three ROI Drivers
The error most business cases make is treating grocery robots as one category with one payback number. There are three distinct jobs, and each one earns its keep differently. Shopping trolley and out-of-stock detection converts to money through recovered sales; the detection method behind it is set out in on-shelf availability and out-of-stock detection.
| Job | Cost it removes | Revenue it adds | Payback logic |
|---|---|---|---|
| Shelf scan / availability | Manual audit labour (2-6 h/day) | Recovered sales from faster replenishment | Sales recovery usually dominates |
| Floor cleaning | Contract or in-house cleaning hours | None directly | Pure labour substitution, most predictable |
| Advertising / retail media | None | In-store media impressions and dwell | Media yield per store per year |
Cleaning is the most predictable of the three because it substitutes a line item the store already pays. Availability is the highest-ceiling because it touches sales, but it carries measurement risk. Advertising is the least certain because it depends on whether the retailer already sells in-store media inventory. A business case that blends all three into a single payback figure hides which of the three is actually carrying the investment, and that is the number the finance team will attack first.
The Per-Store Five-Year Cash Model
Model one store before modelling the chain. Take a mid-size supermarket with 4,000 square metres of floor, 14 trading hours per day and a fully loaded cleaning labour rate of 22 currency units per hour. The cleaning duty currently consumes three hours of contract labour per night, 21 hours per week, 1,092 hours per year, about 24,000 currency units annually. One scrubbing unit at 2.9 hours of scrubbing per pass, run nightly, covers the floor with margin.
The unit's all-in cost, capital plus dock plus installation, sits typically in the range of 18,000 to 30,000 currency units, with an annual service and consumables line of roughly 1,500 to 2,500. Over five years, including a mid-life battery replacement, total cost of ownership runs about 30,000 to 45,000, against a labour line of about 120,000 over the same period. The saving is not the full labour line, because someone still monitors the robot and handles water and detergents, but it is a large majority of it.
| Line | Year 1 | Years 2-5 (annual) | 5-year total |
|---|---|---|---|
| Robot capital + dock + install | 24,000 | - | 24,000 |
| Service and consumables | 2,000 | 2,000 | 10,000 |
| Battery replacement (year 4) | - | 6,000 (once) | 6,000 |
| Supervision and water handling | 3,000 | 3,000 | 15,000 |
| Total cost | 29,000 | - | 55,000 |
| Labour avoided | 24,000 | 24,000 | 120,000 |
| Net position | - | - | 65,000 positive |
Substitute the store's own rate, hours and floor area and the model recomputes. That substitutability is the point. The number used in cleaning robot total cost of ownership is a five-year method, and this model applies it to a single store so it can be replicated across a chain.
Where the Model Breaks
Three things move the result, and a business case that ignores them will be challenged. First, shrink and replenishment discipline. Availability robots surface out-of-stock faster, but only convert that into sales if the replenishment process responds. A detection loop without a restocking loop shows a detection rate, not a sales recovery. The workflow behind that loop is covered in on-shelf availability workflows.
Second, planogram churn. If a category is reset every quarter, the camera model needs re-baselining, and the labour saved in scanning is partly returned as planogram maintenance work. Third, labour agreements. In unionised grocery operations the cleaning duty may be protected work, in which case the replacement is reassignment rather than elimination and the saving is realised as redeployment, not headcount reduction. The finance number is the same only if redeployed hours are genuinely productive.
Rolling Out Across a Chain
Do not model a chain, model a store, prove a store, then scale a store. The staging sequence matters because each stage resolves a different uncertainty. A pilot stage resolves technical fit: can the unit actually navigate this store's aisles during trading hours. A cluster stage resolves operational fit: can three to five stores share a supervisor and a service route. A chain stage resolves commercial fit: does the service contract, spares depot and training model hold at scale. The economics of that staging are set out in multi-site deployment strategy.
The unit counts that emerge from staging are usually lower than a first pass suggests, because clusters share resources. Right-sizing the fleet to the real duty, rather than to the store count, is the difference between a fleet that pays back and one that idles. The method is described in fleet right-sizing.
What to Put in the Business Case
A one-paragraph answer for the finance committee: size the fleet from the store's own aisle metres and floor area rather than from a vendor's recommended unit count; model cleaning as labour substitution because it is the most predictable line; model availability as recovered sales but only where a restocking loop exists; treat retail media as upside, not core payback; and model one store in full before modelling the chain. A business case built this way survives the first challenge meeting because every input is the operator's own number.
How AOMAN Approaches Multi-Store Rollouts
AOMAN deploys cleaning, delivery and advertising robots into grocery and superstore formats, and the rollout method starts with the store's geometry rather than a catalogue. We size the fleet from aisle metres and floor area, run a single-store pilot against the operator's own labour rate, then stage the wider rollout in clusters so supervision and service are shared. The AOMAN C1 floor scrubber and delivery platforms are specified per store, not per chain, and the fleet is monitored through a single management layer as it scales. If you are building a grocery robot business case, start with your own numbers and we will model the fleet against them.
Get a Quote
Tell us about your space and workload, we reply within 24 hours.