
Price Tag Errors: Auditing Shelf Pricing Integrity With Robots
At a glance: A price tag error is one of the few retail failures that costs money in both directions at once. An overcharge triggers consumer-protection exposure and a refund queue; an undercharge gives margin away silently at every single transaction until somebody notices. A shelf-scanning robot does not fix pricing, but it turns a sampled, weekly, human-audited process into a complete, dated, per-shelf record. This guide covers what that record needs to contain, what the scan can and cannot detect, and how to size the audit interval against the actual rate at which prices drift.

Why Price Accuracy Fails at Shelf Level
Most pricing errors are not data-entry mistakes in the price file. They are disagreements between three records that should always match: the price file (what the point-of-sale charges), the shelf edge (what the customer reads before deciding), and the promotional calendar (what the marketing team believes is running). Each record is maintained by a different team in a different system, and each changes on its own schedule.
The common failure modes are consistent across formats:
- Missed shelf-edge update. The price file is changed overnight, the POS charges the new price, and the paper or electronic label is not replaced. This is the largest single category in most audit programmes and it produces overcharges, which is the legally dangerous direction.
- Promotion end not actioned. A two-week promotion closes in the price file but the promotional shelf talker stays up. The customer reads the old offer and the register charges the new price.
- Promotion start not actioned. The reverse, and a pure margin leak: the discount is live in the shelf edge but not in the POS price file, so the store undercharges on every unit for the length of the promotion.
- Label placement error. The correct label exists but sits under the wrong facing or the wrong variant, so a customer reads the price of an adjacent SKU. This is the category that most manual audits miss entirely, because the label is present and correct, just mispositioned.
- Replenishment-driven displacement. A label is knocked off or obscured during a fill, and the gap is not spotted until the next audit cycle.
The rate at which these accumulate depends on promo intensity, the number of SKUs, and how often the shelf edge is maintained by hand. A store running forty promotions a week with paper labels drifts faster than a store running eight promotions with electronic shelf labels, but neither reaches zero. The audit interval should be derived from the observed drift rate, not chosen from habit.
What a Shelf Scan Actually Captures
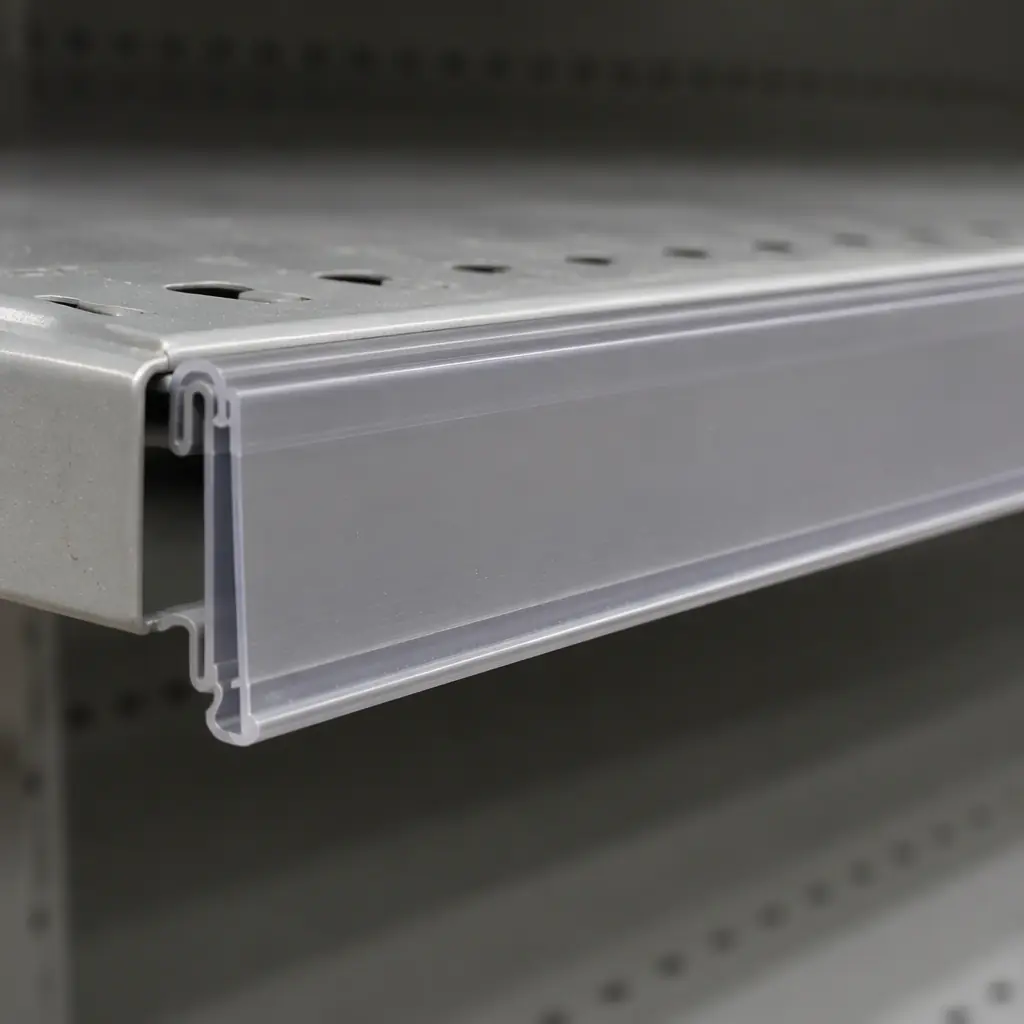
A shelf-scanning robot on a grocery aisle reads the shelf edge with a camera array while travelling at normal walking pace, and resolves the label into a SKU code and a displayed price. The output is a timestamped, geolocated record per facing. That record supports four distinct checks, and it is worth being precise about which are reliable and which are not.
| Check | What it compares | Reliability | False positive source |
|---|---|---|---|
| Label present | Shelf edge versus planogram facing map | High | Damaged or angled labels below read threshold |
| Label matches price file | Displayed price versus POS price for that SKU | High | Multi-buy and conditional offers expressed as a unit price |
| Promotion state correct | Displayed offer versus promo calendar dates | Medium | Regional or store-cluster promo variations |
| Label position correct | Label anchor versus the facing it sits under | Medium | Irregular shelving, mixed facings, themed displays |
| Product present | Facing occupancy versus planogram | Medium–High | Deep-set product, reflective packaging |
Two limitations deserve to be stated plainly rather than discovered later. First, the scan reads the shelf edge, not the register. It compares what the label says against the price file the store published; it does not prove what the POS actually charged a customer. Reconciling those two requires a transaction-level extract from the POS, and the value of the programme comes from joining the two datasets.
Second, conditional pricing defeats simple comparison. “Three for the price of two” or “members save 20 percent” cannot be expressed as a single unit price, so a naive comparison flags every one of them. Mature programmes extract the conditional offer as a separate structured field and validate the unit price and the offer terms separately. A pilot that reports a thirty percent error rate is almost always counting conditional offers as mismatches.
For paper-label stores the same scan works with a lower read rate, because label damage and curvature reduce legibility. Expect the effective capture rate to be meaningfully lower than on a flat electronic shelf edge, and set expectations accordingly before the first audit rather than explaining the gap afterwards.
Pricing the Error: Overcharge Exposure and Margin Leak
An error rate on its own does not justify a programme. What turns it into a business case is converting it into two separate numbers with two separate owners, because they behave very differently.
Overcharge exposure is a legal and reputational number. In most jurisdictions with unit-pricing or consumer-protection rules, a shelf price lower than the charged price is a straightforward breach, and the remedy is to honour the lower price plus, in some regimes, a fixed penalty per incident or a compensation payment. The relevant calculation is the number of affected transactions, not the number of labels, and transactions per affected SKU per day is the multiplier that makes small label counts expensive.
Margin leak is a commercial number with no penalty attached, which is exactly why it is tolerated for longer. An undercharge of a small amount across a high-velocity SKU can outrun the cost of the entire scanning programme while never appearing as an incident, because no customer complains about being undercharged.
Work an indicative example on a mid-size grocery store with 18,000 SKUs on the sales floor, an observed label error rate of 1.4 percent at the first full audit, and a promotional calendar running 35 offers per week:
- Errors found at first audit: approximately 252 facings.
- Of those, a typical split is roughly 45 percent missed shelf-edge updates (mostly overcharges), 25 percent promotion-end failures (overcharges), 15 percent promotion-start failures (margin leaks), and 15 percent position errors (mixed direction).
- Overcharge-direction errors: around 150 facings. At an average exposure of two to six affected transactions per facing per day before correction, that is a daily exposure of several hundred price-dispute events across the estate if the audit interval is a week.
- Margin-leak errors: around 38 facings. A promotion-start failure on a fast-moving line at a two-unit daily rate and a one-unit discount can run into four figures of leaked margin over the life of the promotion.
The important structural point is that the first audit always finds the most. Error counts fall sharply once corrections are made against a complete record, because a large share of the initial count is historic drift that had been accumulating for months. A business case built on the first-audit error rate and projected forward will overstate the steady-state benefit; the second and third audit cycles give the honest rate.
That fall is also the argument for continuous scanning rather than a one-off clean-up. Correcting 252 labels fixes today. It does not stop next week’s 35 promotions from generating their own errors, and the drift rate is a function of promotional intensity, which does not decline.
Sizing the Audit Interval From Drift Rate
The single most useful number in a pricing-integrity programme is the drift rate: the number of new label discrepancies generated per SKU per week. It converts the audit interval from an arbitrary choice into an arithmetic decision.
Estimate it from two consecutive full audits. Take the count of new discrepancies found at the second audit that were not present and corrected at the first, divide by the number of SKUs, and divide by the weeks between audits. A store finding 90 new discrepancies across 18,000 SKUs over four weeks has a drift rate of roughly 0.00125 discrepancies per SKU per week, or about 22.5 new discrepancies per week across the estate.
That number sets the interval. If the tolerance is that no discrepancy should persist for more than a week, the required scan frequency is weekly and the weekly load is 22.5 corrections, which is a small amount of labour. If the tolerance is a fortnight, the load per cycle doubles to 45 corrections and the average exposure time doubles with it. The interval is a policy choice about how long a customer can encounter a wrong price, and the drift rate tells you what that choice costs in corrections.
| Scan interval | Average discrepancy age | Discrepancies live at any time | Corrections per cycle |
|---|---|---|---|
| Daily | 12 hours | ~16 | ~3 |
| Twice weekly | 1.75 days | ~39 | ~11 |
| Weekly | 3.5 days | ~79 | ~23 |
| Fortnightly | 7 days | ~158 | ~45 |
| Monthly | 15 days | ~338 | ~97 |
The table makes the trade visible. Moving from weekly to daily scanning cuts the number of simultaneously wrong labels from about 79 to about 16, a reduction of roughly eighty percent in the exposure a customer can actually encounter, at the cost of scanning a store five more times. Since the marginal cost of a scan on a robot already patrolling the aisle is close to zero, the arithmetic usually favours scanning more often than the audit committee initially assumes.
Two practical caveats. The drift rate is not uniform across the store: promotional aisles, end caps and high-velocity categories drift far faster than the ambient centre store, so a uniform interval over-scans some aisles and under-scans others. And the drift rate spikes around seasonal reset events, which should be treated as scheduled exceptions with a dedicated post-reset audit rather than left to the routine cycle.
Closing the Loop: From Record to Corrected Shelf
A scan that produces a report nobody actions is worse than no scan, because it creates a documented record of known non-compliance. The workflow after the scan is where the programme either works or quietly dies.
The essential design decision is where the correction is made. There are three options and they have different ownership:
- Store-level task. The discrepancy appears on a store task list and a colleague walks the aisle to replace the label. Fastest, works on any label technology, and the only option for paper labels. Its weakness is that it competes with every other task on a short-staffed shift.
- Central price-file correction. For the category where the label is right and the price file is wrong, the fix belongs to the pricing team, not the store. Routing this to the store produces a “cannot fix” outcome and erodes trust in the task list.
- Electronic shelf label push. Where labels are electronic, many discrepancies can be resolved by forcing a re-sync to the shelf edge without a physical visit. This is the highest-leverage case and the strongest argument for pairing a scanning fleet with an ESL estate.
Routing correctly is the difference between a programme that closes ninety percent of findings inside twenty-four hours and one that closes forty percent and then stops being checked. The scan record should carry enough information to route automatically: the discrepancy type, the SKU, the facing, and whether the mismatch is label-side or price-file-side.
The second requirement is a verified close. A task marked complete is not the same as a label corrected, and the only trustworthy verification is the next scan of that facing. Programmes that measure closure on task completion report excellent numbers and leave wrong prices on shelves; programmes that measure closure on the following scan’s clean result report the truth.
Finally, retain the record. A dated, per-facing history of what the shelf said on a given day is the only practical defence against a regulatory inquiry or a consumer complaint about a past price. That archive has value independent of the operational workflow, and it should be retained on a defined schedule rather than discarded with the weekly report.

What to Specify Before You Buy
Pricing-integrity requirements are frequently bolted onto a general autonomy or cleaning purchase, and then under-delivered because the specification never asked for them. The following points are worth putting in the requirement document explicitly.
- Read rate by label type. Ask for capture rate on paper labels and on ESL separately, at the store’s actual shelf geometry, not on a demo aisle. A single blended figure conceals the paper-label weakness.
- Conditional-offer extraction. Confirm that multi-buy, member pricing and threshold offers are extracted as structured fields and excluded from naive unit-price matching. Ask to see a report from a store with a heavy promotional calendar.
- Routing metadata. The export must carry discrepancy type, SKU, facing coordinates and a label-side versus price-file-side flag, in a format the store task system and the pricing team can both consume.
- POS reconciliation. Define how the shelf record joins to transaction data, and who owns that join. This is usually the difference between a compliance tool and a margin tool.
- Retention and export. Specify the retention period for per-facing price history and confirm the data can be exported in full, without per-record fees, if the relationship ends.
- Scan cadence independence. Confirm the scan can run on any schedule, including several times a day, without additional licence cost per scan.
It is also worth being clear about what the robot does not replace. It does not fix the underlying process that allows the price file and the shelf edge to diverge, it does not resolve which price is legally correct, and it does not allocate the correction work. Those remain management decisions. What it does replace is the sampling: instead of auditing two percent of facings on a rotating basis and extrapolating, the store audits one hundred percent and knows exactly which labels are wrong.
For operators evaluating the wider fleet question alongside pricing integrity, the arithmetic in the on-shelf availability guide covers the lost-sales side of the same scan, and the retail media analysis covers how the same shelf data supports a media proposition. The buy-versus-lease payback comparison applies directly if the scanning fleet sits on the same platform.
A 90-Day Implementation Sequence
Pricing-integrity programmes fail on social grounds more often than technical ones. The corrections land on store teams who were not consulted, the first report reads as an accusation of their work, and adoption stalls. The sequence below front-loads the agreement.
Days 1–15, baseline and agree the definition. Run a manual audit of a representative sample using the exact definition the robot will use, including how conditional offers are treated. Publish the manual error rate first. The purpose is to establish that the problem is process-wide rather than a reflection on any individual, and to agree the counting rules before anyone is measured against them.
Days 16–45, parallel run. Scan the same aisles the manual audit covered and compare. Time spent reconciling the two counts is the highest-value work in the whole programme, because every disagreement is either a definition problem or a robot limitation, and both need to be found now.
Days 46–70, routing and closure. Wire the task list to the store and the price-file findings to pricing. Measure time-to-close and, critically, verify closure by re-scan rather than by task completion.
Days 71–90, interval and drift. With two full cycles of data, compute the drift rate and set the standing interval from it. Present the first honest before-and-after: discrepancies live at any time, time-to-correct, and the split between overcharge exposure and margin leak.
The metric to carry into the business case is not the error rate at the first audit. It is average discrepancy age, because that is the number that maps directly to customer encounters and to regulatory exposure, and it is the number that improves most visibly once continuous scanning replaces periodic sampling.

The Bottom Line
Price tag accuracy is a process problem that a robot can measure completely and a store can only sample. The value is not in finding errors for their own sake but in shortening the window during which a customer can encounter one, and that window is set by the audit interval, which should be derived from the measured drift rate rather than inherited from the manual audit calendar.
Three things determine whether the programme holds: a definition that handles conditional offers honestly, routing that sends each discrepancy to the party who can actually fix it, and closure verified by the next scan rather than by a ticked task. Get those three right and the error count falls to a low steady state within two quarters. Get them wrong and the store acquires a well-formatted weekly report of problems nobody owns.
If you are scoping a scanning fleet and want the shelf-data requirement written alongside the autonomy and cleaning specification, the AOMAN product range and the navigation and sensing platform documentation cover what the platform records per pass. For the wider commercial case, the RaaS financing comparison sets out how a scanning subscription is priced against outright purchase, and the KPI benchmark set gives the operational targets to hold a fleet to once it is live.
Send us the store format, SKU count and promotional intensity and we will size the scan cadence and correction load against your own drift rate rather than a generic assumption.