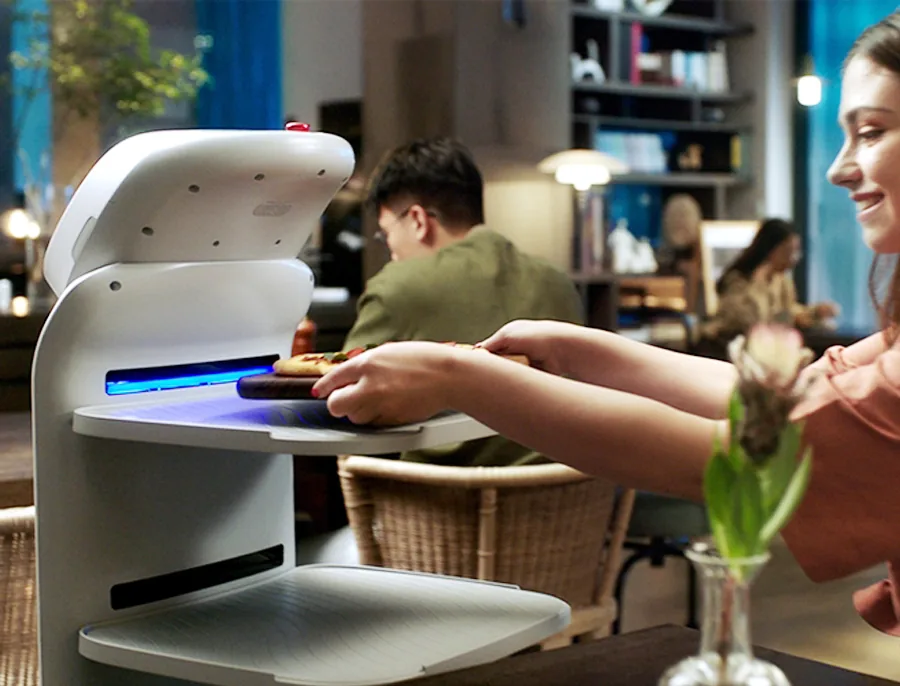
Service Robots for Convention Centers & Exhibition Halls — Staffing the 50,000 m² Show Floor
At a glance: A convention center has the hardest duty cycle in commercial facilities — the building is empty on Monday, holds 30,000 people on Wednesday, and is a demolition site by Thursday night. This guide covers the four robot roles that fit that rhythm, the four-phase show cycle they have to survive, and the load, floor and lift constraints that decide fleet sizing before any vendor quote is credible.
The economics of a convention center are unusual. The building earns revenue on event days, but the cost structure — halls, climate, security, housekeeping — runs every day of the year. A venue that hosts 180 events annually is generating revenue roughly half the calendar year and carrying full fixed cost for all of it. That imbalance is what makes venue operators receptive to automation, and also what makes them ruthless about payback: a robot that only helps during events is a robot that has to pay for itself in days, not years.
The venues that get it right do not buy a robot for a single job. They fit automation into the four-phase operational rhythm that every exhibition hall already runs on, and they choose roles that work in all four phases rather than only during show days.
The Four-Phase Exhibition Cycle (And What Has to Happen in Each)
Understanding the cycle is the prerequisite for any deployment decision, because a robot that is excellent in one phase and useless in the other three will not survive a procurement review. Here is the cycle as it actually runs at a mid-to-large venue, with the floor and staffing reality of each phase.
| Phase | Duration | Floor State | Staffing Pain | Robot Fit |
|---|---|---|---|---|
| 1. Move-in / build-up | 1–4 days | Pallets, crates, cabling, temporary structures | Freight routing, dock congestion, last-mile hauling from dock to stand | High — D1 tray hauling for light freight, C1 pre-event deep clean |
| 2. Show days | 1–5 days | Peak density, 1.5–3 m² per attendee in aisles | Wayfinding, queue management, continuous floor presentation, staff fatigue | High — G1 wayfinding and check-in, C1/C2 Pro continuous cleaning |
| 3. Move-out / tear-down | 1–2 days | Debris, tape residue, carpet offcuts, cable ramps | Fast turnover to next event; hard deadline | Medium — C1 post-event clean once freight clears |
| 4. Dark / turnaround | 1–5 days | Empty halls, maintenance access | Deep clean, carpet replacement, marking repaint | High — C1 large-area scrub at 2,040 m²/h |
The critical insight from that table is that the cleaning fleet is the only asset that works in all four phases. Wayfinding and check-in duties are concentrated in phase 2 and idle the rest of the month. Light-freight hauling clusters in phases 1 and 3. But the C1 scrubber is useful during build-up (pre-event presentation floor), show days (continuous aisle cleaning between sessions), tear-down (debris clearance after freight moves out), and turnaround (large-area deep clean). This is why venues with the strongest payback records lead with cleaning capacity and add wayfinding as a second, guest-facing layer.
Fleet Sizing: Working From Floor Area, Not Headcount
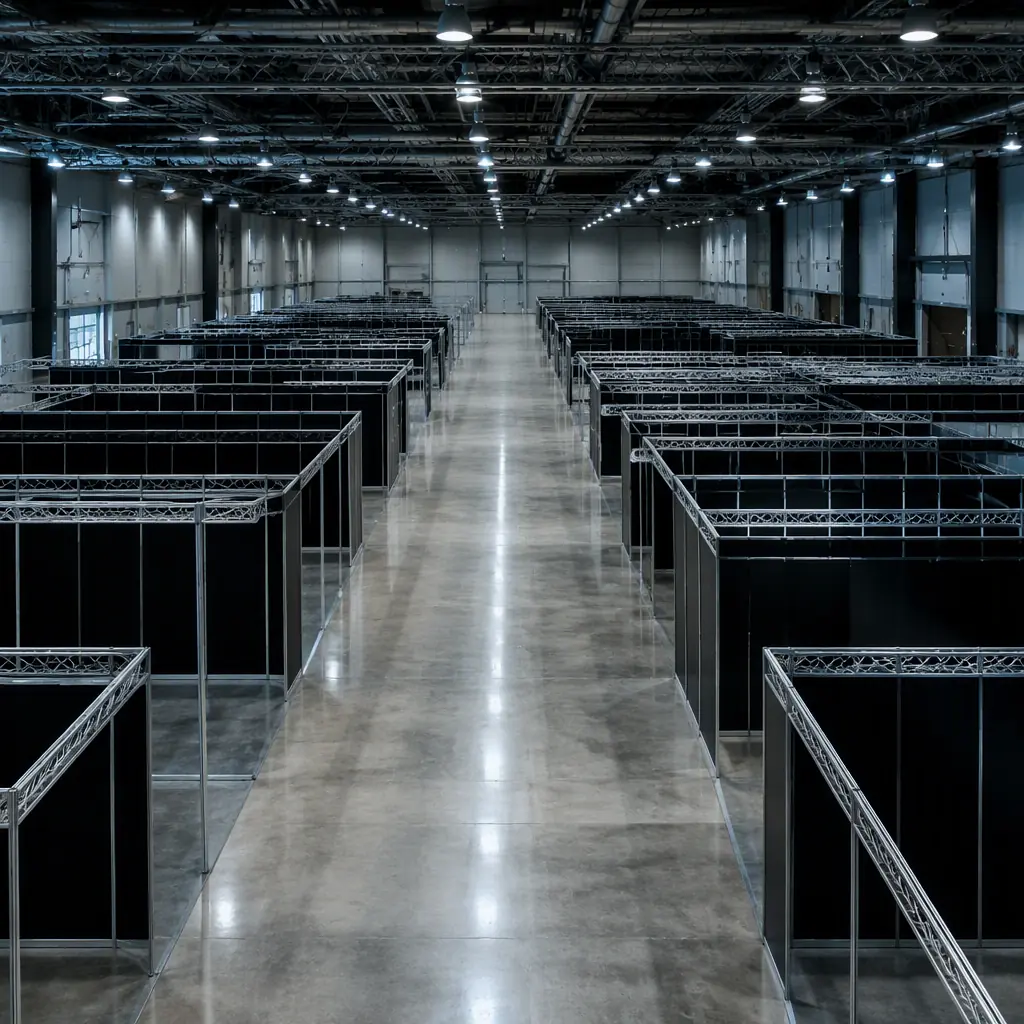
Vendors who quote fleets by attendee count are guessing. The correct driver is cleanable floor area, because that is what determines machine-hours, and machine-hours is what determines how many units you need. The calculation below uses published AOMAN C1 performance figures so the arithmetic is auditable.
Step 1 — cleanable area. Take the venue's gross hall area and subtract non-cleanable zones: stand footprints during show days, staging areas, service corridors, and structural obstacles. At a venue with 50,000 m² of gross exhibition space, cleanable aisle and common area during a show typically runs 35–45% of gross — call it 20,000 m².
Step 2 — machine-hours. The AOMAN C1 cleans up to 2,040 m²/h across a 790 mm squeegee. Dividing 20,000 m² by 2,040 m²/h gives 9.8 hours of pure cleaning time. That is a single unit's worth of work for one full show day.
Step 3 — apply efficiency and windows. Real-world efficiency for a scrubber working around people, stands and standing water runs 55–70% of rated rate. At 60%, 20,000 m² becomes 16.3 machine-hours. A venue that wants aisles cleaned twice daily during a three-day show therefore needs 32.6 machine-hours per show day, spread across the available off-aisle windows (typically 06:00–08:00 and after 18:00, roughly four usable hours per day).
Step 4 — fleet count. 32.6 machine-hours ÷ 4 usable hours = 8.2 units minimum, plus one spare for fault cover, giving a practical show-day fleet of 9. That is a real number a procurement team can defend, and it is derived from floor area and published rate rather than from a vendor's slide.
Why the 790 mm squeegee matters here and not elsewhere. Wide-format scrubbers win in exhibition halls because the dominant cost is pass count, not turn radius. A 790 mm squeegee covers a 3 m aisle in four passes; a 440 mm C2 Pro needs seven. Multiply that difference by 20,000 m² and the C2 Pro's role inverts: it stops being the big-floor machine and becomes the narrow-aisle and hospitality-area machine, cleaning the 700 mm-clearance service corridors and the F&B concourse that the C1 physically cannot enter.
The Four Roles That Fit a Venue
Each role below maps to a specific venue function, a specific product, and a specific payback mechanism. Venues that deploy all four are running a layered operation rather than a pilot.
1. Guest wayfinding — the AOMAN G1
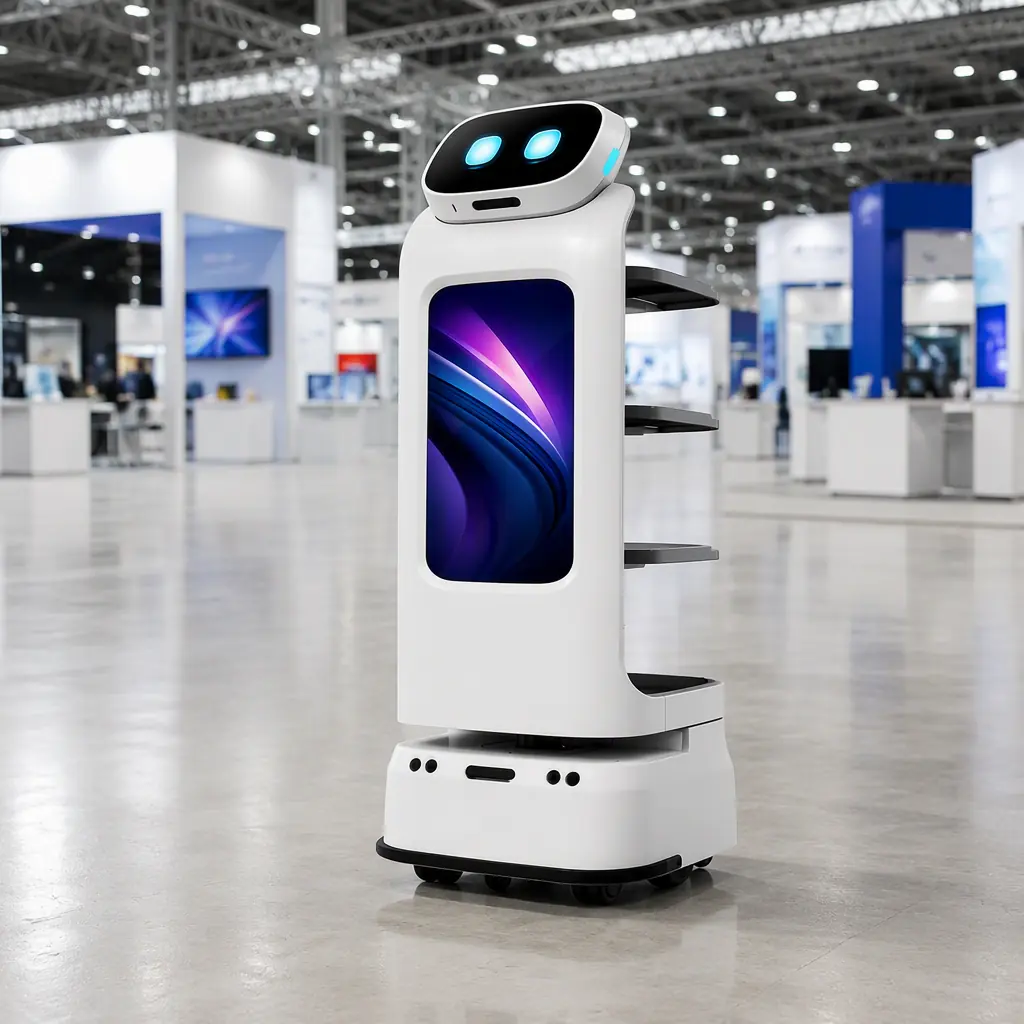
The single largest source of attendee friction in a convention center is navigation. Halls are numbered in ways that make sense to logistics planners and nobody else; a visitor who arrives at Hall 4 looking for a company in Hall 7 has a fifteen-minute problem and no person to ask. G1 addresses this with a head expression screen plus a chest information screen, a 6-mic circular array with 5 m pickup for voice interaction, and SLAM navigation with stereo obstacle avoidance that requires no beacons or rails — floor mapping is done on site. With roughly 33 kg body weight and hub-motor drive with suspension damping, it moves through peak-density crowds at walking pace without becoming a hazard.
The payback mechanism for wayfinding is not labour savings — it is information-desk deflection and, more importantly, the quality metric that venues increasingly have to report. Attendee satisfaction surveys consistently rank wayfinding among the top complaints, and rebooking decisions are made by organizers comparing venues. A fleet of guidance units that answers "where is Hall 7 booth 3B12" is a retention investment, not an efficiency one.
2. Light material movement — the AOMAN D1
During build-up and tear-down, the constraint is not the truck, it is the last 200 metres. Freight arrives at the dock and has to reach a stand that may be eight halls and two lifts away. The AOMAN D1 carries 40 kg across four 10 kg tiers with 270° open tray access, so a team can load from either side without unloading the stack, and it measures 1,265 × 484 × 551 mm — narrow enough for service corridors. Its 202°/55° radar pair and RGBD depth camera give it the field of view to work in halls where pallets are parked unpredictably.
Used during build-up, the D1 turns a two-crew material shuttle into a one-crew operation with a robot making continuous round trips. It is also the only role here that integrates with goods lifts, which is the constraint examined in the elevator integration guide.
3. Continuous floor presentation — AOMAN C1 and C2 Pro
Exhibition halls are judged on floors. Attendees walk 8–12 km in a day; spills happen in F&B zones; a hall with visible tracked-in dirt reads as badly managed regardless of how well the show is produced. Continuous cleaning during show days is therefore a presentation requirement, not a housekeeping preference.
The operational pattern that works is a two-machine split. The C1 — 120 L total tank capacity (70 L clean / 50 L dirty) with float sensors, dual-SLAM LDS plus V-optical fusion navigation, 3D ToF surround vision with ~20 ms response, and ≤32 dB operating noise — handles the main aisle network on a repeating circuit. The low noise figure is operationally decisive: venue noise floors during a show are already high, and a machine that can work within 3 metres of a conversation about a six-figure equipment purchase without disrupting it is a machine that can clean during operating hours rather than only at night.
The C2 Pro handles the complement: 440 mm cleaning width, 700 mm narrow-aisle clearance, three operating modes (dust-mopping, vacuuming, scrubbing), up to 11 h endurance in dust-mopping mode and roughly 4,400 m² per run. Its job is the F&B concourse, the registration corridor, the hospitality suites and the service passages where the C1 will not fit. Modular tanks, batteries and brushes with second-quick release mean a swap takes seconds, which matters in an environment where the machine cannot be taken offline during show hours.
4. Registration and check-in triage — the AOMAN G1
The second G1 duty runs on the same hardware but a different workflow: the registration hall at 08:30, when 6,000 badge holders arrive inside forty minutes. G1's 13 MP vision and voice interaction handle the repetitive triage — which queue, which hall, where the cloakroom is — while staff handle exceptions. Venues running this pattern report the measurable effect at the door rather than in the queue: staff who are not answering directional questions are processing badge exceptions, which is the actual bottleneck.
Infrastructure Constraints That Decide Feasibility
Before any fleet is ordered, four constraints have to be verified on site. Venues that skip this step discover them during commissioning, at which point the fleet is already purchased.
| Constraint | Why It Matters | How to Verify |
|---|---|---|
| Floor flatness and step height | C1 climbs 6° ramps and senses 5 cm obstacles at toe height; expansion joints and cable ramps are the usual failure points | Survey hall transition points and dock ramps; measure actual joint drops |
| Min turning clearance | C1 needs 200 cm turning clearance — narrower than most aisle grids, but tighter than some service corridors | Measure the tightest corridor on the intended route, not the average aisle |
| Charging capacity and dock siting | C1 runs 24 V / 120 Ah lead-acid with approximately 8 h charge; a 9-unit fleet charging simultaneously draws several kW plus dock floor area | Confirm circuits in the dock zone and 5–8 m² of flat, dry, accessible wall per unit — see the charging architecture guide |
| Lift and door interfaces | D1 hauling depends on goods lifts; G1 wayfinding routes cross public lift banks | Test call-button integration or confirm manual lift-attendant coverage on show days |
The floor constraint deserves emphasis because it is the most commonly mis-scoped. Exhibition halls are designed for heavy vehicle access, not for autonomous navigation. Cable ramps laid across aisles during build-up are invisible to a robot's obstacle model until it is directly on top of them; temporary structures create corridors narrower than the building's nominal minimum. Any deployment plan should be walked with a laser measure before the fleet is specified — a two-hour survey prevents a two-month problem.
The Four-Week Path From Decision to Show Day
Venue deployments have a property that ordinary facility deployments lack: a hard external deadline. The next show is booked, the organizer has a move-in schedule, and there is no version of "we will finish commissioning next month." The following sequence fits inside one event cycle with margin.
| Week | Activity | Deliverable | Owner |
|---|---|---|---|
| Week 1 | Site survey: floor transitions, corridor widths, dock power, lift interfaces, hall mapping boundaries | Signed survey sheet and fleet count derived from floor area | Venue engineering + vendor |
| Week 2 | Floor mapping per hall (SLAM, no beacons or rails), charging dock installation, network coverage check at dock points | Maps loaded, docks live, connectivity verified | Vendor commissioning |
| Week 3 | Dry-run cleaning cycles on empty halls; G1 wayfinding content loaded with hall, stand and amenity data; operator training on the trolley workflow | Trained operator roster, patrol content approved | Venue ops + vendor |
| Week 4 | Live shadow run during a low-stakes event; exception logging; route and schedule tuning | Fault log, tuned schedules, go/no-go for the next major show | Venue ops |
The shadow run in week 4 is the step venues are tempted to compress, and it is the one that produces the most value. Small events expose the exception classes that matter — the stand that parks a forklift in the robot's path, the gangway that fills with chairs at 17:00, the water fountain that floods a corridor. Every exception caught in a 2,000-attendee show is an exception that does not derail a 30,000-attendee show.
Safety, Crowds, and the Duty-of-Care Question
Convention centers carry a duty-of-care standard higher than an office building because attendees include children, elderly visitors, and people with mobility aids, all moving in dense, unpredictable patterns. Three provisions are non-negotiable.
Speed limiting in occupied zones. C1 operates at 1.0 m/s in autonomous mode and 1.2 m/s in manual mode; in a hall with 1.5 m² per attendee, the autonomous ceiling should be reined in further through the scheduling layer, not relied upon as a safety margin. The 3D ToF surround vision with approximately 20 ms response is the enforcement mechanism, but the operating envelope is the primary control.
Emergency route protection. Exits, stairs and emergency routes are non-negotiable no-go zones. They must be excluded from maps and from scheduled circuits, and the exclusion has to survive map updates — a re-mapping after a hall reconfiguration must not silently reinstate a route that crosses an evacuation path.
Escalation structure. Whoever runs the show needs one named contact for robot behaviour and one escalation channel for guest-facing incidents, on every show day. A single support page in the operations binder is the difference between a fix in four hours and a fix recounted at the post-show review.
The privacy side is comparatively simple if the architecture is right. Occupancy-aware scheduling only needs zone-level states; it does not need video frames or individual tracking. The boundary that matters — what the platform receives and what stays on the device — is set out in the security and privacy review.
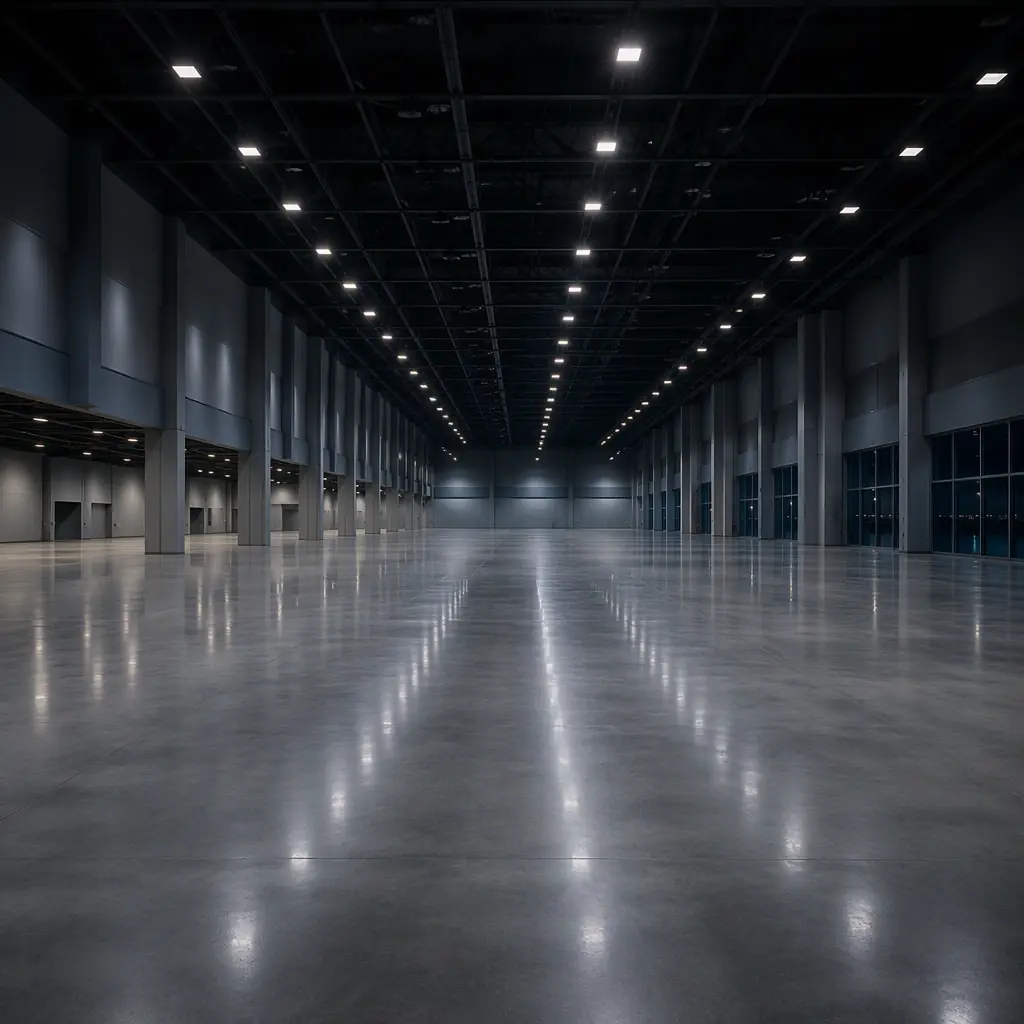
What Venues Should Measure in the First 90 Days
Convention centers have an advantage over other facilities in measurement: events are discrete, and each one is a natural experiment. Five metrics, tracked per event, will show within a quarter whether the deployment is working.
Floor coverage per machine-hour. Compare delivered square metres against the rated 2,040 m²/h to establish the venue's true efficiency factor. Most venues land between 55% and 70%; the number is a property of the venue, not the machine, and it is the input to every future fleet sizing decision.
Turnaround hours between events. The interval from freight-out to floors-ready is the single most commercially significant number in a venue operation, because it determines how many events the calendar can hold. A cleaning fleet that shortens turnaround by four hours can add events to a year.
Fault-to-recovery time. Mean time from fault event to robot back in service. This is where spare-unit provisioning proves or disproves itself, and where the total cost of ownership model in the maintenance guide becomes concrete rather than theoretical.
Wayfinding interaction volume. Count of guidance interactions per event day. This is the leading indicator for whether the G1 fleet is deflecting information-desk load or simply adding a novelty that attendees photograph and ignore.
Attendee-reported navigation satisfaction. Taken from post-event organizer surveys. This is the metric that supports rebooking, and it is the honest test of whether the guest-facing layer is doing real work.
Cost Shape and Where the Return Comes From
Venue deployments have a cost structure that differs from a single-building installation, because everything scales with fleet and with event frequency. Rather than quote a single figure, it is more useful to understand the four cost blocks and the three return sources, because venues negotiate these very differently depending on how many units and how many events are in scope.
The four cost blocks. (1) Fleet capital or lease cost, which scales with unit count and is the largest line. (2) Dock and power infrastructure, which is a one-time fit-out per venue and does not scale linearly with fleet. (3) Mapping and content commissioning per hall — G1 wayfinding content is venue-specific and has to be rebuilt when halls are reconfigured, so this recurs. (4) Annual platform licence and support, which typically bundles fleet visibility, scheduling and the maintenance layer.
The three return sources. (1) Turnaround compression, which converts directly into additional event capacity on the calendar — this is usually the largest financial return and the least often modelled at procurement stage. (2) Housekeeping labour reallocation, which is a shift of headcount to tasks that require judgement rather than a headcount reduction, since venue labour is event-peaked and hard to flex downward. (3) Rebooking retention, driven by attendee experience and organizer confidence, which is indirect and slow but compounds year over year.
The venues that achieve the shortest payback are not the ones that bought the largest fleet. They are the ones that bought capacity for the show-day peak and then found additional uses for the same machines during build-up, tear-down and dark phases — turning a machine that was economically justified for four hours a day into one that works across the whole event cycle. For a venue evaluating this alongside other capital decisions, the same logic is modelled in the service robot ROI framework, and where funding needs to be structured as operating rather than capital spend, a RaaS contract can fold the fleet, docks and support into a single monthly figure tied to event days.
Tell us your gross hall area, the number of halls you need mapped, and the tightest corridor clearance on your main aisle network — we will help you derive a fleet count from the arithmetic rather than from a brochure, and scope the four-phase role split that fits your event calendar. Contact us.