Advertising Robot Peak-Hour Scheduling: Route, Audience and Impression Arithmetic
At a glance: An advertising robot sold on impressions fails the first month it is scheduled like a cleaner. A supermarket lobby generates twelve to twenty times more qualified passers-by in the 17:00 to 20:00 window than at 09:00, and a route that ignores that curve delivers the same robot-hours for a fraction of the audience. This guide covers the hourly audience curve, how to draw a route from it, what share of screen time a paid campaign can honestly claim, and the utilisation arithmetic that turns a media rate card into a realistic monthly impression forecast.
The failure mode is predictable and it is not technical. A robot arrives with a programme built for cleaning: start at 09:00, sweep the perimeter, avoid the aisles that are restocking, finish at 17:00, dock. The screen plays the whole day. The advertiser receives a monthly report showing 240 hours of playback and asks the obvious question, how many people actually saw it. Nobody in the building can answer, because nobody measured the footfall curve the robot was walking through.
The Hourly Audience Curve Comes Before the Route
Schedule the robot against the audience curve, not against the cleaning rota. On a typical suburban supermarket lobby the qualified audience concentrates into roughly 29 percent of the trading hours but carries about 53 percent of the daily footfall, so the first scheduling decision is which four hours the robot spends where, and the second is what it does with the other twelve. The curve is measurable before a robot is bought, from the store's own door counters, POS transaction timestamps or loyalty-app check-ins, and it is remarkably stable week to week outside of holiday periods.
A representative trading day for a 2,400 m² supermarket in a mixed residential catchment, expressed as index points where the average hour equals 100:
| Window | Footfall index | Audience character | Robot implication |
|---|---|---|---|
| 07:00 to 09:00 | 55 | Commuter top-up shop, high dwell on convenience aisles | Low audience; best used for cleaning and restocking support |
| 09:00 to 11:30 | 70 | Older shoppers, deliberate dwell, high attention to signage | Reception position; longest stop dwell pays off |
| 11:30 to 14:00 | 105 | Lunch break, quick trip, low dwell | Front-of-store transit loop; do not park |
| 14:00 to 17:00 | 60 | School run and quiet hours | Replenishment aisles; useful for category messaging |
| 17:00 to 20:00 | 190 | Family shop, full basket, 25 to 40 minute dwell | Highest-value window: front-of-store anchors plus aisle loops |
| 20:00 to 22:00 | 80 | Late top-up, low crowd, less congestion | Full-aisle sweep; easier navigation, lower audience |
Read against the clock, the 17:00 to 20:00 window is three of fourteen trading hours, or 21 percent of the time, and it indexes at 190 against an average of 100, which sums to roughly 53 percent of daily footfall. Any schedule that spreads robot presence evenly across the day will therefore spend two thirds of its media asset on one third of its audience.
Turning the Curve into a Route
Once the curve is on one page, the route becomes an arithmetic problem rather than a preference. Three numbers are needed for each window: the audience index, the dwell available for the screen, and the distance the robot can cover in that window without obstructing the aisles.
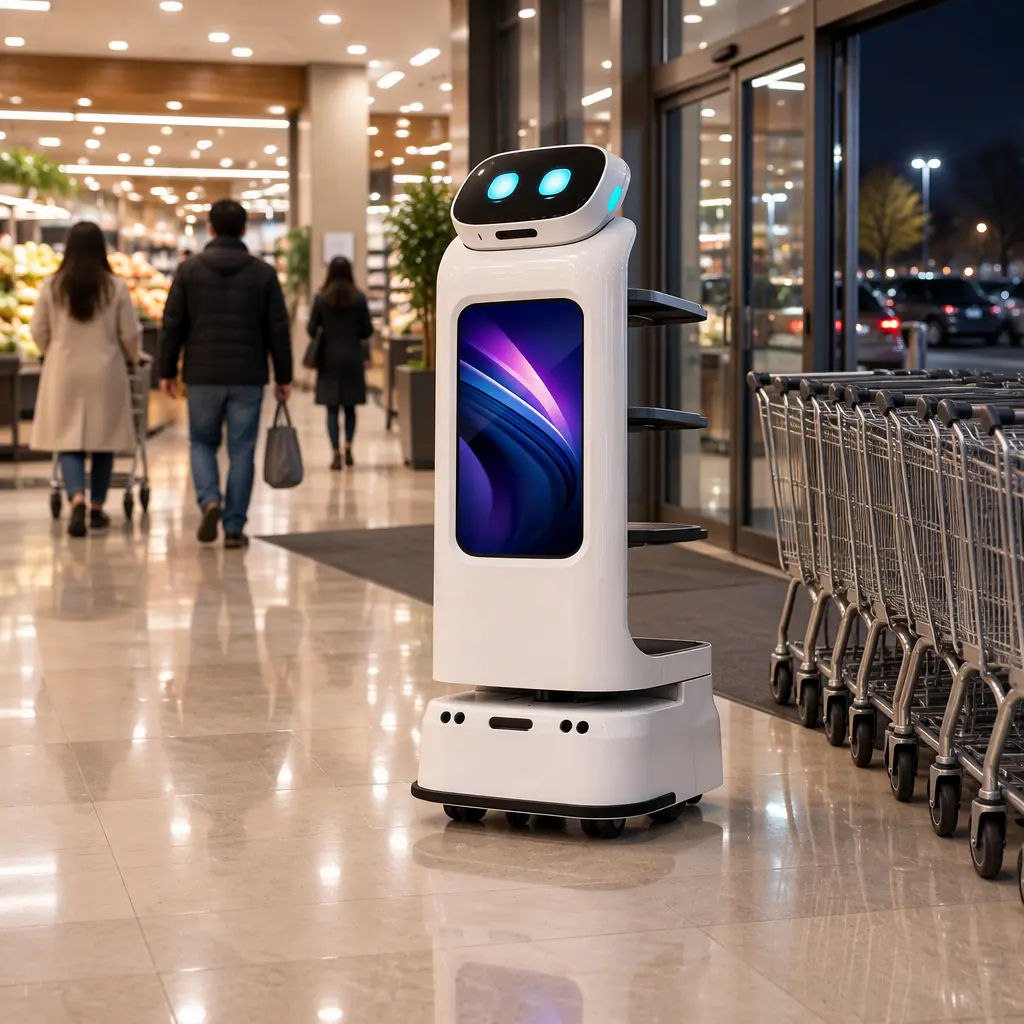
- Anchor dwell beats continuous movement. In a lobby with 25 to 40 minute dwell times, a robot that parks at an entry sightline for 8 minutes and then moves on is seen by more of that window's traffic than a robot that never stops. Movement attracts a glance; position attracts attention. Plan two to four anchors per store, each with a clear line of sight from the trolley approach.
- Transit is for coverage, not for impressions. Aisle loops reach shoppers who are already deciding what to put in the basket. They are the right place for category messaging and the wrong place for brand awareness that needs repetition.
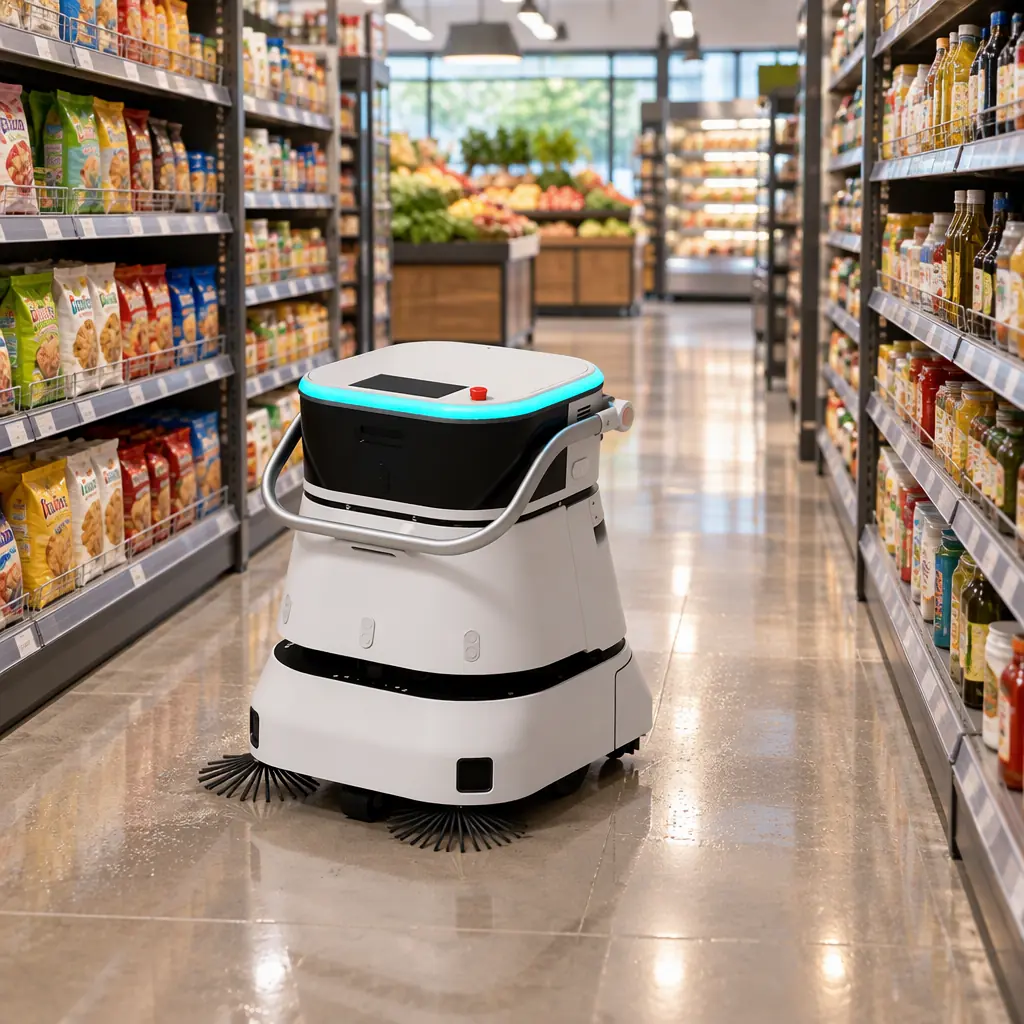
- Congestion sets the ceiling. In the 17:00 to 20:00 window a 1.2 m wide robot moving at 0.6 m/s is a traffic object. Field programmes typically cap transit speed at 0.4 to 0.6 m/s in peak and prefer short staged moves between anchors over long loops.
- Dwell is measurable. Most fleet platforms log the time the robot spends above a set number of detected people in its camera field. That log is the only honest denominator for an impression claim, and it should be contracted, not discovered in month three.
How Many Robot-Hours a Window Actually Needs
A worked example, using a 2,400 m² supermarket with one advertising robot and a 14-hour trading day. The robot is available for 12 hours because two hours go to charging and cleaning handover.
| Step | Value | Note |
|---|---|---|
| Daily footfall, door counter | 3,100 | Entries, not unique people; a family shop counts as one to two entries |
| Robot-hours available | 12 h | After charging and cleaning duty |
| Hours in the 17:00 to 20:00 window | 3 h | Holds 53 percent of footfall, about 1,640 entries |
| Remaining hours assigned to media | 5 h | The other 4 h of the 12 stay on cleaning duty, see below |
| Total media robot-hours | 8 h | 3 h peak plus 5 h off-peak |
| Entries per media robot-hour | 3,100 / 8 = 388 | Blended; the peak hours carry about 547 per hour and off-peak about 292 |
The blended figure is the number that belongs in a proposal, and it should never be quoted without the window breakdown next to it. A supplier who quotes 388 entries per hour across the day is arithmetically right and commercially misleading: the advertiser buying the 09:00 to 11:00 window alone is buying about 216 entries per hour, not 388.
Where the fleet has more than one unit, the same curve decides how many robots should be media-active at all. Two robots in a 2,400 m² store during the peak window reach the same shopper twice, which is worth something for a launch and almost nothing for a mature campaign. One unit in peak plus a second unit in the 11:30 to 14:00 and 20:00 to 22:00 shoulder windows usually beats two units in peak. The arithmetic behind that trade is the same as any media duplication model, and it is covered from the acquisition side in the buy versus lease payback analysis.
Cleaning and Media Share the Same Hours
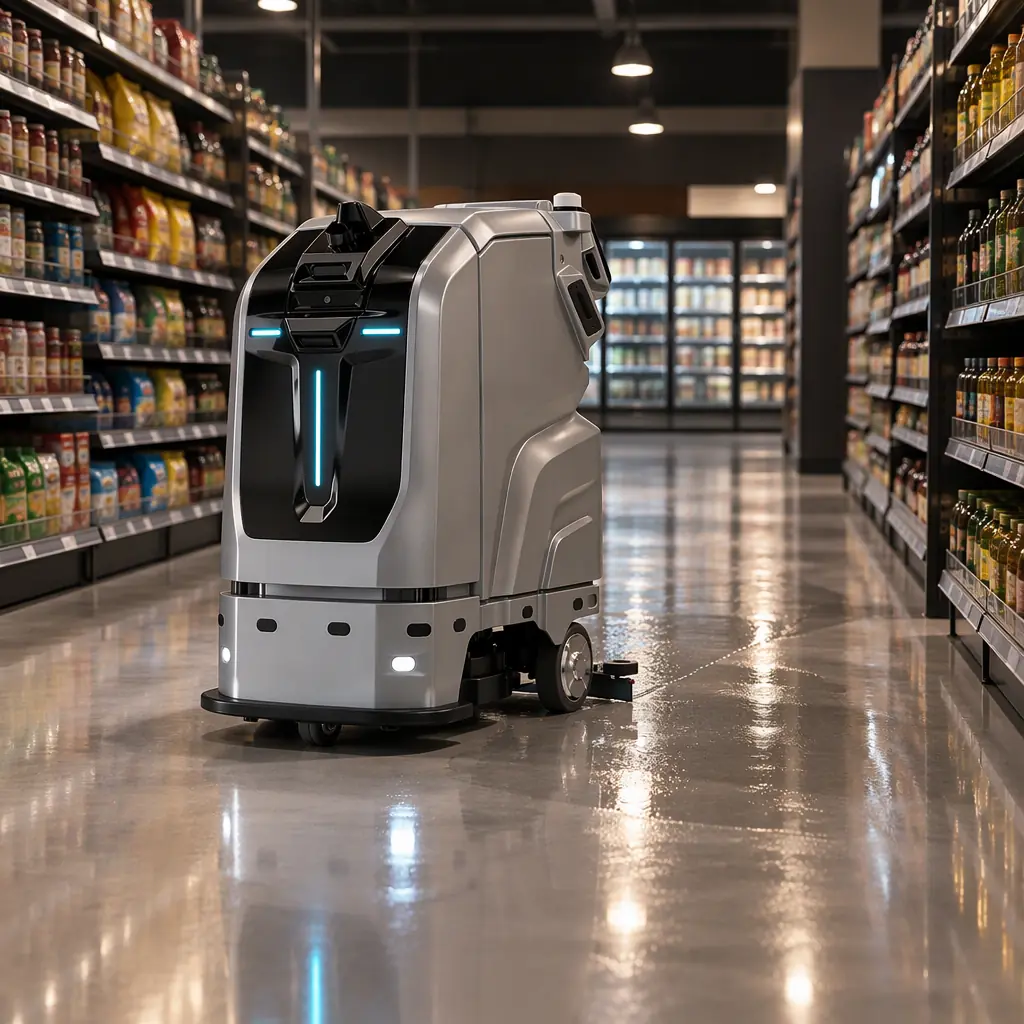
Most deployments fund the robot as a dual-purpose asset, which is honest but only works if the split is scheduled rather than assumed. A scrubber that is also a media unit has a conflict at exactly the worst moment: the floor needs doing when the store is empty, and the screen needs to be seen when the store is full.
- Assign cleaning to the low-index windows. The 07:00 to 09:00 and 20:00 to 22:00 windows index at 55 and 80, together about 19 percent of footfall. A closing-time scrub plus an early-morning pass covers the floor without competing with the audience.
- Never schedule a scrub in the peak window for the sake of the screen. Wet floors in a crowded aisle are a liability, and customers walking around a machine are not watching its display.
- Price the media side net of cleaning hours. If a proposal quotes a monthly impression figure, the robot-hours behind it must exclude cleaning duty. Cleaning hours that quietly sit inside a media number are the most common cause of a campaign that reports well and delivers nothing. The unit economics of the cleaning duty itself are set out in the cleaning robot labour cost model.
Where the fleet runs a dedicated advertising unit rather than a dual-purpose scrubber, the constraint moves from floor condition to battery. A screen at 400 to 600 nits and a speaker at moderate volume add 40 to 90 W to the platform draw, which is 4 to 8 percent of a compact scrubber's motion load and enough to remove one hour from a shift on a marginal pack. Sizing that correctly is a chemistry and duty-cycle decision more than a capacity decision.
What an Impressions Contract Should Pin Down
Media buyers are used to audited numbers and robot proposals rarely provide them. Four clauses close most of the gap, and all four are available from standard fleet telemetry.
| Clause | What it fixes | Typical negotiable value |
|---|---|---|
| Window definition | Which hours count, by clock, per site | Named windows with an audience index attached |
| Active-play definition | Whether docked time, cleaning time and idle time count as media hours | Media hours only when on route and screen active |
| Exposure proxy | What counts as an impression | Detected-person encounters within a set distance, logged per hour |
| Make-good rule | What happens after a downtime day | Hour-for-hour credit in the following month, capped |
The exposure proxy deserves the most argument, because it is the number the whole rate card rests on. Camera-based detection over-counts in dense crowds and under-counts when the screen faces a wall. A practical settlement is a detected-person count within a 4 m frustum, reconciled monthly against the door counter, with a stated tolerance band. If the robot reports 12 percent more encounters than the door counter records entries, the higher figure is not a better campaign, it is a measurement error.
Dwell quality matters as much as raw counts in this window. A shopper standing at a trolley for 30 seconds beside a screen has a different recall profile from one walking past at 1.2 m/s, and the fleet log can separate the two if the contract asks for it before the campaign starts rather than after.
Peak-Hour Scheduling Checklist
- Pull 28 days of door-counter or POS-timestamp data and build the hourly index before writing the route.
- Identify the two highest-index windows and protect them from cleaning duty entirely.
- Define two to four anchor positions with clear sightlines from the trolley approach, and stage short moves between them.
- Cap transit speed in peak windows and keep the robot out of the two busiest aisles during the 17:00 to 20:00 period.
- Contract the impression proxy, the active-play definition and the make-good rule before month one.
- Report per window, never blended. The blended number hides exactly the mistake the schedule was built to avoid.
How AOMAN Supports Advertising and Reception Programmes
AOMAN builds the D1 delivery, C1 and C2 Pro cleaning and G1 reception platforms, and quotes the advertising and reception configurations with the same fleet telemetry that logs media hours, anchor dwell and detected-person counts, so a per-window report is available from the first month rather than assembled by hand. Buyers running a dual-purpose schedule can have the cleaning windows, media windows and charging plan set up at commissioning; buyers specifying OEM or ODM units can have the screen mounting and content player integrated at the factory. Platform details are on the products page, and the fleet data model is described on the technology page.
Continue Reading
- Buy or lease an advertising robot: payback on a retail media asset
- Advertising robots in supermarkets: rate cards and revenue streams
- Pedestrian traffic management around service robots
- Cleaning robot labour cost model
- Battery chemistry and duty-cycle selection for service robots
- Service robot fleet management