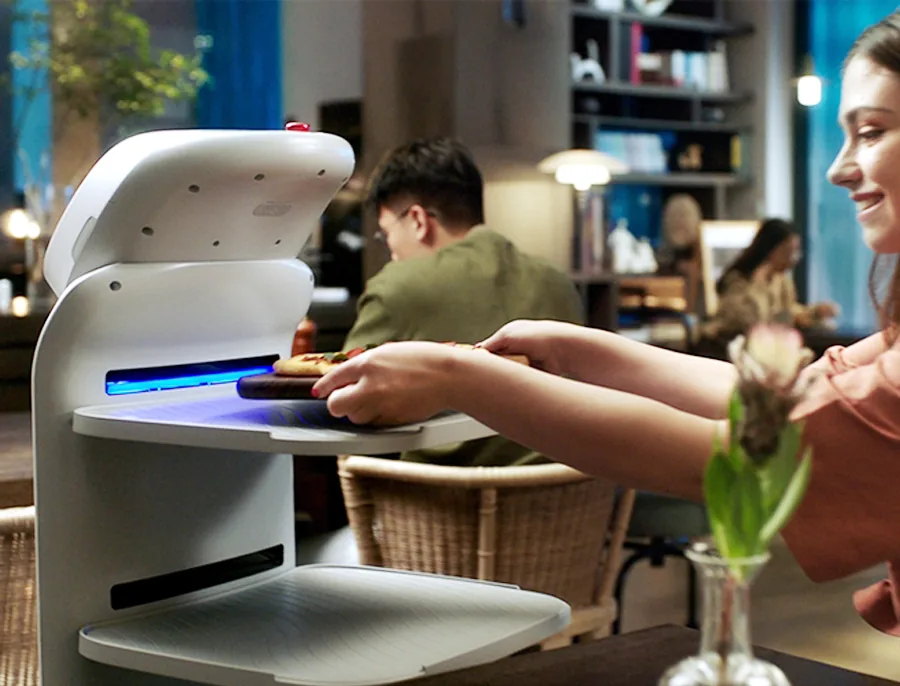
Serving Robot Cost Per Delivered Tray: The Five-Year Ledger
At a glance: A serving robot is usually approved on the sticker price and then survives or fails on the cost per delivered tray. This article builds that number from the bottom up: capital or subscription cost, docks and network works, energy, consumables and spares, service contract, insurance, the labour that still has to wrap around the robot, and the food waste that a hotter delivery can avoid. It then runs three operating profiles through the same model so the decision rule that matters, the annual delivered-tray count above which ownership beats a lease, is a number rather than an opinion.
Why the Sticker Price Decides Almost Nothing
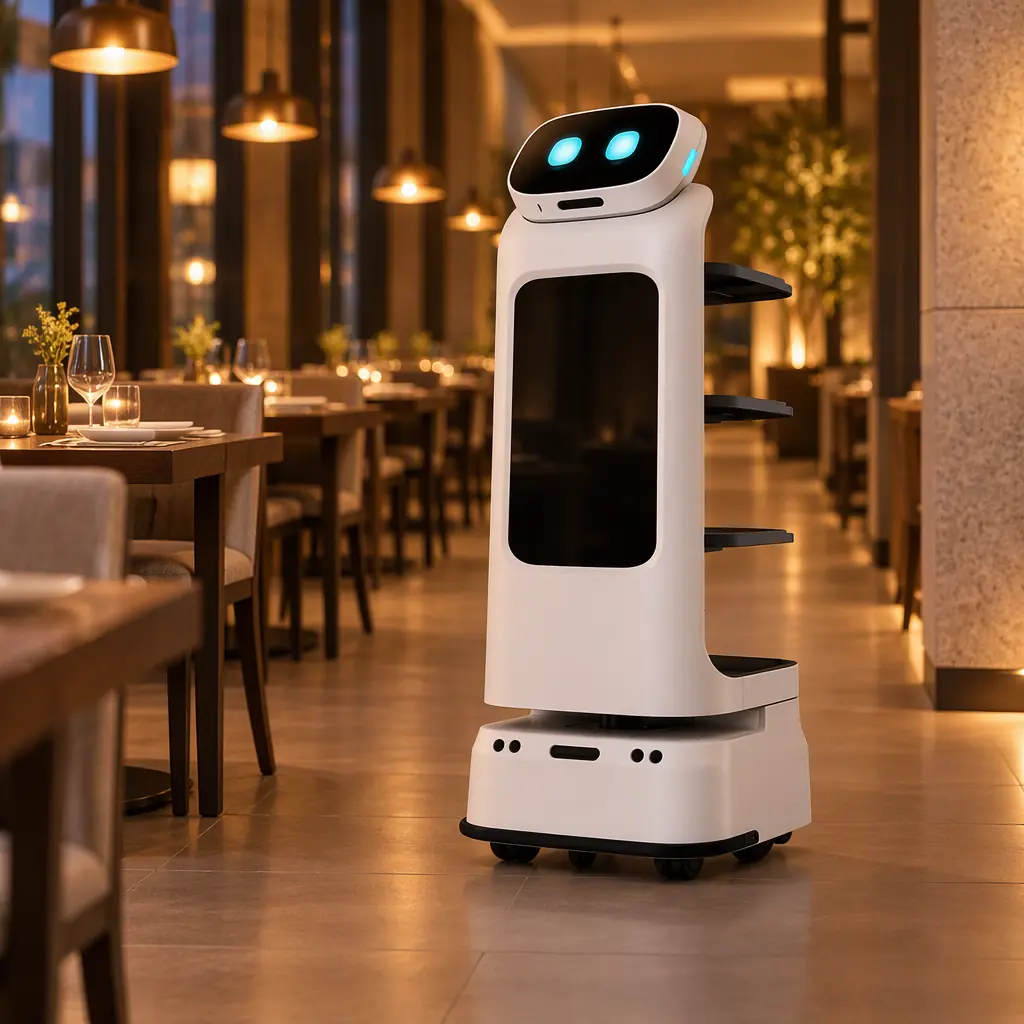
A mid-market serving robot with three shelves, a 40 kg payload and a 10 to 12 hour duty cycle typically lists between USD 9,000 and USD 18,000 ex-works. A restaurant operator comparing quotes will anchor on that spread and treat the four-figure difference as the decision. It is not. Over a five-year life at a busy site the robot delivers on the order of 60,000 to 110,000 trays, and every ongoing cost line scales with that number, not with the purchase price.
The unit that makes the comparison honest is cost per delivered tray: total cost of ownership divided by trays carried from pass to table over the life of the asset. Three sites running the same model can differ by a factor of three on this metric, because they differ on utilisation, on labour release, and on how much of the integration work they had to pay for twice.
| Cost line | Typical five-year share of TCO | Scales with | Easy to miss |
|---|---|---|---|
| Capital or subscription | 40 to 55 percent | Units, not usage | No |
| Docks, network and floor works | 5 to 9 percent | Site, not usage | Yes, frequently |
| Energy | 3 to 5 percent | Deliveries and distance | No |
| Consumables and spares | 4 to 7 percent | Deliveries and hours | Yes, shelves and trays |
| Service contract and repairs | 8 to 14 percent | Units and years | Partly, out-of-warranty year 3+ |
| Insurance and compliance | 2 to 4 percent | Units and site | Yes, often unmodelled |
| Residual labour around the robot | 12 to 25 percent | Deliveries | Yes, the largest hidden line |
| Waste avoided (credit) | minus 1 to minus 4 percent | Deliveries and menu | Yes, usually omitted entirely |
The two lines that decide most business cases are at the bottom of that table. Residual labour is the handling a server still has to do because a robot cannot take an order, cannot pour, cannot answer a question about an allergen, and cannot clear a table. Waste avoided is the credit the finance team usually refuses to book until it has been measured on the operator's own menu.
Building the Five-Year Ledger
The ledger below is written for a single unit at a site running lunch and dinner service seven days a week, with an average of 240 deliveries per day and a five-year planned life. Capital is taken at USD 13,500 including the first dock. Every figure is expressed so it can be replaced with the operator's own quote.
| Line | Basis | Year 1 | Years 2 to 5 (each) | Five-year total |
|---|---|---|---|---|
| Robot and first dock | Purchase, net of tax recovery | 13,500 | 0 | 13,500 |
| Second dock and floor works | Site survey, cabling, signage | 1,800 | 0 | 1,800 |
| Wi-Fi survey and access points | Two APs, one-time | 1,100 | 0 | 1,100 |
| Energy | 1.9 kWh per day at USD 0.22 | 152 | 152 | 760 |
| Shelves, trays, bumpers | Replacement and loss | 380 | 380 | 1,900 |
| Service contract | From month 13, 9 percent of capital | 0 | 1,215 | 4,860 |
| Budgeted repairs | Wheel set, sensor, harness | 150 | 420 | 1,830 |
| Insurance uplift | Public liability and property | 180 | 180 | 900 |
| Staff time on the robot | 0.6 h per day at USD 19 all-in | 4,161 | 4,161 | 20,805 |
| Total cost | 21,423 | 6,508 | 47,455 |
At 240 deliveries a day and 350 trading days a year the unit carries 84,000 trays a year, 420,000 over five years. That puts cost per delivered tray at roughly USD 0.113 before any waste credit. If the operator recovers 1.5 percent of food cost on a USD 28 average cover across those 420,000 deliveries, the credit is about USD 17,600 over the life, and the net cost per tray falls to about USD 0.071.
Two features of this ledger deserve emphasis. First, the residual labour line at USD 20,805 is 44 percent of the total cost and larger than the robot itself. Second, the service contract that starts in month 13 is frequently absent from vendor payback claims, which almost always quote a clean year-one comparison.
What the Robot Still Cannot Do
Every serving robot on the market in 2026 handles the same narrow job: move a loaded tray from a defined pickup point to a defined drop point, and go back. The residual labour figure in the ledger is the arithmetic of everything outside that job.
| Task | Robot capability | Residual staff time per delivery | Notes |
|---|---|---|---|
| Load tray at the pass | None, human loads | 15 to 25 s | Second-largest residual task |
| Confirm destination | Table number or zone | 3 to 6 s | Falls to near zero with QR or table beacon |
| Unload at table | Guest or staff unloads | 20 to 40 s | Highest variance by venue type |
| Take order | Menu display only | Not replaced | Full FOH role remains |
| Answer allergen questions | None | Not replaced | Compliance-sensitive, must stay human |
| Clear and reset table | Return leg only if loaded | 10 to 20 s | Depends on bussing layout |
| Handle a spill or complaint | None | Exception only | Requires supervisor response |
Summed, the residual tasks sit between 48 and 91 seconds per delivery. At 240 deliveries a day that is 3.2 to 6.1 hours of staff time, which is why the ledger uses 0.6 hours rather than zero. Any payback model that assumes a full server headcount is replaced will overstate the saving, and this is the single most common reason a serving robot business case fails an audit eighteen months after approval.
The honest framing for a CFO is not headcount replacement but headcount avoidance at the margin: the site that would otherwise roster four servers on a Friday night runs three plus a robot, and the fourth body is only hired when the robot is down for more than a shift.
Lease, Subscription and Purchase Side by Side
The same 84,000-tray annual volume run through three acquisition routes gives three different cost curves, and the ranking flips with utilisation. The subscription figures below are modelled at 22 percent of capital per year with consumables and service included, which is a common structure but not universal; the important comparison is the shape of the curve, not the specific rate.
| Route | Year 1 cash | Five-year cash | Cost per tray at 84,000/yr | Cost per tray at 26,000/yr |
|---|---|---|---|---|
| Purchase, owned service contract | 21,423 | 47,455 | 0.113 | 0.365 |
| Lease to own, 48 months | 8,900 | 49,100 | 0.117 | 0.377 |
| Subscription, all inclusive | 2,970 | 31,400 | 0.075 | 0.242 |
The subscription column looks unbeatable, and at low utilisation it genuinely is, because the operator carries no residual value risk and no service exposure. The purchase column wins only under two conditions: the site exceeds roughly 55,000 deliveries a year, and the operator intends to keep the asset past year four. Below that threshold the fixed subscription cost per tray rises faster than any capital saving.
The break-even arithmetic is simple enough to state as a rule. Let annual subscription be S, capital plus five-year owned running cost be C, and annual deliveries be D. Subscription wins while D is below C divided by five S. For the numbers above that threshold is 302 deliveries per trading day. A site running only dinner service, at 140 covers, should subscribe. A site running lunch and dinner at 240 to 300 covers should buy, provided it has the balance sheet and the maintenance discipline for it.
Two Operators, Two Answers
The model above is only useful if it produces different decisions for different sites. Two representative cases, both running the same three-shelf model:
| Parameter | Operator A: city-centre casual dining | Operator B: hotel all-day dining |
|---|---|---|
| Deliveries per trading day | 265 | 120 |
| Trading days per year | 358 | 365 |
| Annual deliveries | 94,870 | 43,800 |
| Average cover value | USD 24 | USD 34 |
| Residual labour per delivery | 52 s | 71 s |
| Staff all-in rate | USD 19/h | USD 23/h |
| Chosen route | Purchase | Subscription |
| Cost per delivered tray | USD 0.096 | USD 0.211 |
| Decision driver | Volume absorbs fixed cost; residual labour is small | Seasonal volume dips to 60 covers; residual labour is high |
Operator A amortises the capital over a volume that absorbs it and gets the lowest cost per tray of any profile in this article. Operator B has the higher residual labour because hotel guests expect tray handling at the table and often need guidance, and the seasonal trough means the robot idles for part of the year. For B the subscription is the correct answer not because it is cheaper in absolute terms but because the risk of a stranded asset in a seasonal venue is real.
The transferable lesson is that cost per tray, not payback period, is the metric that survives contact with operations. Payback period is computed at a chosen volume and then quietly invalidated by the first menu change or staffing restructure.
Where the Model Goes Wrong
Four modelling errors account for most of the disagreements between vendor payback claims and audited results. Each has a specific correction.
- Counting a full headcount as released. The correction is to model residual labour per delivery, as in the table above, and to cap the released headcount at the number of roles the roster would genuinely have carried without the robot.
- Omitting the service contract after warranty. Year three is when a serving robot starts costing real money. A 9 percent of capital annual contract is typical; some vendors quote 12 percent for sites with heavy tray loads.
- Assuming the dock is free. Two docks, a floor marking job and a Wi-Fi survey typically add USD 2,000 to USD 3,500 per site, and a site with poor 5 GHz coverage will need access points as well.
- Booking the waste credit without measuring it. A hotter delivery does reduce waste on some menus more than others. The credit should be modelled as a range, measured in the first 90 days, and only then written into the business case.
There is a fifth error with a longer tail: treating the robot as a permanent asset in a venue that is itself changing. Operators that renegotiated their lease term, changed their menu format or refitted the dining room within the robot's life had to re-site docks and re-map routes, and a re-map is not free even when it is included in a service contract.
The 90-Day Measurement Plan
The numbers in this article are a planning envelope. Every site should replace them with measured values before committing beyond the first unit, and 90 days is enough to get the four figures that matter.
| Metric | How to capture it | Target by day 90 |
|---|---|---|
| Deliveries per trading day | Robot trip log, exclude empty return legs | Within 10 percent of the business case |
| Residual labour per delivery | Two half-day time observations, one peak and one off-peak | Measured, not assumed |
| Downtime hours | Log every stopped shift with a reason code | Under 2 percent of scheduled hours |
| Waste avoided | Compare waste weight for two identical menu weeks | Measured range, not a point estimate |
| Guest interaction incidents | Front-of-house exception log | Trending down after week 6 |
If all five land inside tolerance the ledger is validated and the second unit can be approved on the measured numbers. If residual labour comes in materially higher than modelled, the right response is usually a layout or process change rather than abandoning the project: a table beacon, a dedicated loading position at the pass, or a bussing route that lets the robot carry clean and dirty in one loop can recover most of the gap.
For sites still shaping the requirement, the operating envelope matters as much as the price. A model sized for 40 kg of tray load and a 12 hour duty cycle has different energy and consumable lines from one sized for a four-hour evening peak only, and the delivery robot selection criteria published by AOMAN set out the same arithmetic for larger platforms. For venues where the robot is also a guest-facing element rather than a pure runner, the reception and concierge deployments show how the residual-labour profile changes when the unit carries wayfinding and menu content as well as trays.
The decision rule in one line: divide five-year total cost by expected trays over five years. If that number is below the value of the staff time it actually releases plus the waste it measurably avoids, buy. If it is not, subscribe, and re-run the arithmetic at the end of the first busy season.
Frequently Asked Questions
How much does a serving robot cost per tray delivered?
Across the three operating profiles modelled here, between USD 0.07 and USD 0.21 per delivered tray including residual labour, energy, consumables, service and insurance. Volume is the dominant factor: the same unit at 84,000 trays a year costs roughly a third per tray of the same unit at 26,000 trays a year.
Is it cheaper to lease or buy a serving robot?
Leasing or subscribing is cheaper for sites below roughly 300 deliveries per trading day, because the fixed subscription cost is spread over fewer trays while the capital purchase cannot be recovered. Purchase wins above that threshold and only if the operator intends to hold the asset for at least four years.
How much staff time does a serving robot actually save?
Between 48 and 91 seconds of residual handling per delivery remains, counted as loading at the pass, destination confirmation, unloading and occasional clearing. The robot removes the walking and carrying, not the handling, so the saving is best modelled as marginal headcount avoidance rather than headcount replacement.
What is excluded from a typical serving robot quote?
Docks beyond the first, floor marking, Wi-Fi coverage works, insurance uplift, the post-warranty service contract, and shelf and tray replacement. Across the ledger in this article those exclusions add about USD 9,000 over five years on a USD 13,500 purchase.
Unit economics for the three-shelf platform are published on the AOMAN D1 delivery robot page, and the tray-carrying specification that drives the energy and consumable lines is documented alongside it.