Cleaning Robot Water and Detergent Costs, The Arithmetic Behind Cost per 1,000 m²
At a glance: Capital and labor dominate every cleaning budget, so water and chemical get assumed to be free. They are not. This guide gives the three inputs that drive consumption, a worked monthly example for a 3,000 m² site, a robot-versus-manual water comparison, and the counter-intuitive failure mode that raises cost more than under-dosing ever does.
Ask a facilities team to model the five-year cost of a cleaning robot fleet and they will produce a capital schedule, a service contract and a labor comparison. Ask what the fleet spends on water and detergent, and the answer is usually a shrug and a note that "it's included in consumables." That line item is small per night and material per year, and because it scales directly with area cleaned, it is the cost that grows quietly as a programme expands.
This guide does what the vendor datasheets do not: it converts tank capacity and dilution ratio into a cost per 1,000 m², works a full monthly example, and compares the number against the manual method the robot replaced. All unit prices below are illustrative ranges, set out openly so you can substitute your own.
The Operating-Cost Line Item Nobody Budgets
Three costs get modelled in a robot business case. The purchase price or lease, the service and maintenance contract, and the labor the fleet is expected to displace. Water and chemical sit outside all three, because they are normally recorded against the building's utility and supplies budget rather than against the robot programme. That accounting separation is why the number hides: nobody is looking at it from the robot side.
The size of the omission depends on the method the robot replaced. A large-format scrubber covering 3,000 m² five nights a week moves a surprising volume of solution per month, and the detergent metered into it is a real recurring cost. What matters for planning is not the absolute figure but the shape of it: consumption scales linearly with area, it rises or falls with dilution discipline, and it is one of the few operating costs a facility can directly control after installation.
Three Inputs, One Formula
Water and chemical consumption reduces to three measured quantities, and everything else is arithmetic.
| Input | Where You Find It | Typical Range | Effect on Cost |
|---|---|---|---|
| Tank capacity and fills per shift | Datasheet solution tank, plus observed refill count | 40–120 L per tank on commercial scrubbers | Sets the water volume directly |
| Area covered per fill | Metered from a full tank to the low-level alert, on your floor | 900–2,000 m² per fill depending on machine and soil level | Converts litres into litres per 1,000 m² |
| Detergent dilution ratio | Chemical label and the dosing setting actually used | Commonly 1:100 to 1:400 | The single largest swing factor, and the least supervised |
The formula is compact. Litres per 1,000 m² equals 1,000 divided by area-covered-per-fill, multiplied by tank capacity. Chemical volume per 1,000 m² equals the water volume divided by the dilution ratio. Multiply each by your unit prices, and you have a defensible cost per unit of area that can be extended to any site size or cleaning frequency.
Worked Example: A 3,000 m² Site, Five Nights a Week
Take a mid-size commercial site: 3,000 m² of hard floor cleaned five nights a week, roughly 21 nights a month, with one large-format scrubber. The machine has a 90 L solution tank, covers 1,200 m² per fill on this floor, and is dosed at 1:200. Unit prices are illustrative and deliberately round: water at €4.00 per m³, detergent concentrate at €9.00 per litre.
| Quantity | Calculation | Result |
|---|---|---|
| Water per full coverage | 3,000 m² ÷ 1,200 m² per fill × 90 L | 225 L per night |
| Water per month | 225 L × 21 nights | 4,725 L = 4.73 m³ |
| Water cost per month | 4.73 m³ × €4.00 | €18.92 |
| Detergent per night | 225 L ÷ 200 | 1.13 L concentrate |
| Detergent cost per month | 1.13 L × 21 × €9.00 | €212.63 |
| Combined monthly cost | €18.92 + €212.63 | €231.55 |
| Cost per 1,000 m², one pass | €231.55 ÷ (3,000 m² × 21 ÷ 1,000) | €3.68 per 1,000 m² |
| Water per 1,000 m² | 4,725 L ÷ 63 thousands of m² | 75 L per 1,000 m² |
Two things are worth reading off that table. First, detergent is roughly eleven times the water cost, even at a moderate 1:200 dose, because concentrate is priced per litre and water per cubic metre. Second, and more useful for planning, the consumed quantities are small enough that this line item will never dominate a budget but large enough that a tenfold dilution error is a four-figure annual overrun rather than a rounding difference. The arithmetic is not about the money. It is about the discipline the money makes visible.
Robot Versus Manual: Where the Water Actually Goes
The comparison that decides most business cases is not robot against nothing. It is robot against the mop-and-bucket method it replaced. The two consume water in structurally different ways, and the difference favours the metered machine on all three counts.
| Factor | Metered Scrubber | Mop and Bucket |
|---|---|---|
| Solution applied | Metered flow across the brush deck, uniform | Manual dip and wring; highly variable by operator |
| Recovery | Squeegee and vacuum return most solution to the recovery tank | None; all applied water stays on the floor to evaporate |
| Rough water per 1,000 m², single pass | 55–90 L applied, of which a substantial share is recovered | 150–350 L applied, of which none is recovered |
| Chemical accuracy | Fixed dilution from a dosing injector | Estimated by eye; re-bucketed mid-shift as solution dilutes |
| Repeat passes for same result | One to two | Two to three where soil load is moderate |
| Net water per completed task | Lowest | Typically two to four times higher |
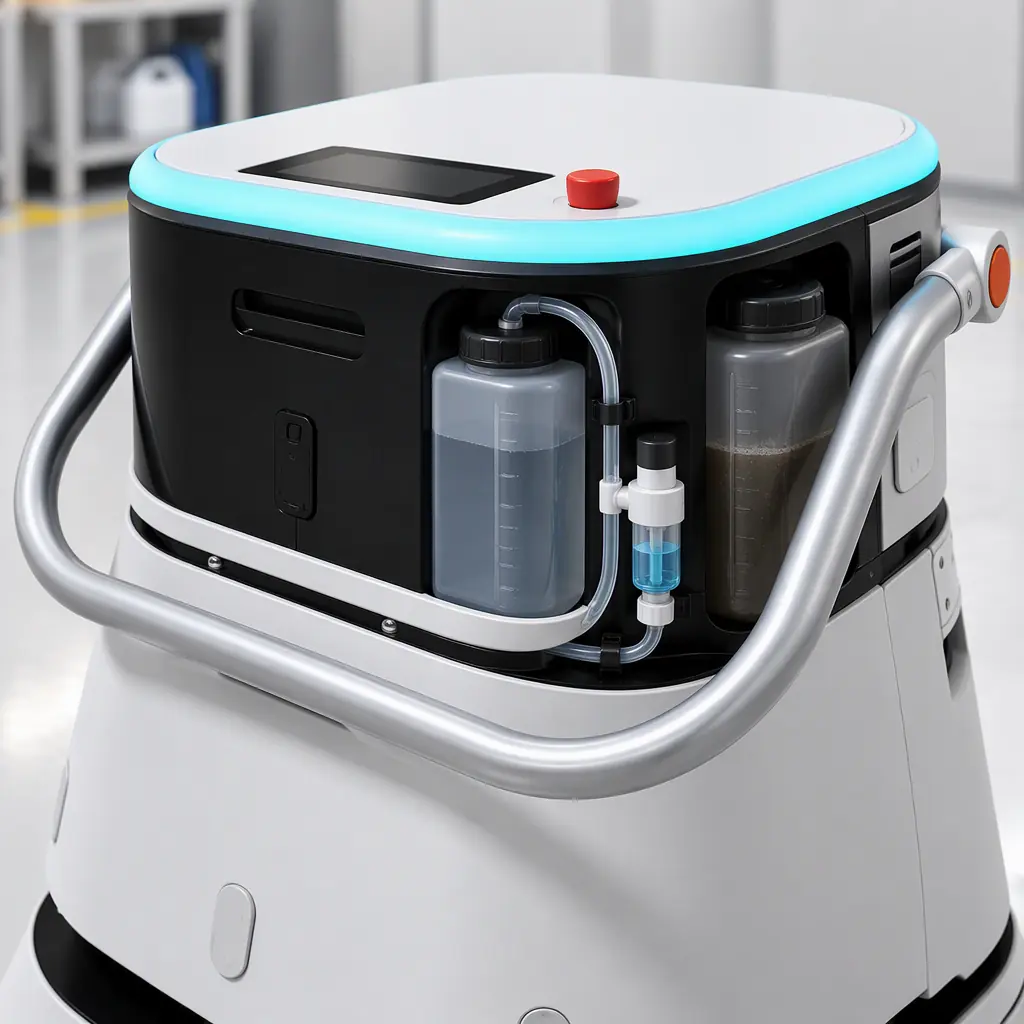
The recovery tank is the mechanism behind the gap. A scrubber applies solution, scrubs and then physically lifts most of it back off the floor before it can evaporate or spread. A mop applies solution and leaves it. On a large hard-floor site that difference compounds through the number of passes needed, which is why the manual method routinely consumes several times the water per completed task even though each individual bucket looks modest.
Chemical consumption follows the same logic but with an important caveat: the manual method often uses *more* detergent per litre of water, because operators re-dose by eye and concentrate builds up through a shift. The metered machine uses less chemical and uses it consistently. Consistency is the real prize, because it is what makes the next section the most common cost surprise in the field.
Over-Dosing Is a Cost *and* a Safety Problem
The intuitive fear is under-dosing: too little detergent, dirt left behind. In practice the far more common and more expensive failure is the opposite. Detergent is cheap per litre relative to the consequences of using too much of it, so when in doubt operators add more. Four costs follow.
First, residue. Excess surfactant dries to a film on hard floor, which shows as streaking under low-angle light and, on treated stone, can dull the finish over months. The remedy is another pass with clean water, which doubles both water and labor. Second, slip risk. Surfactant residue is slippery when damp, and a freshly cleaned hard floor with a film on it is a genuine liability exposure in a public building. Third, rework. A filmed floor requires the same area to be cleaned again, so the over-dosed pass was not merely wasteful, it created the next task. Fourth, finish damage. Repeated over-dosing on natural stone or certain coated floors can degrade the surface itself, converting a consumable cost into a capital one.
Metered dosing is the control. A fixed-ratio injector removes the operator judgment that produces variability in both directions, and it makes the consumption figure auditable, which in turn makes any drift visible. The practical advantage of the robot is not that it uses less chemical by design. It is that it uses the same amount every night, so the number you model is the number you get. The wider recurring-cost picture, including pads, squeegees and filters, is set out in planning spare parts and consumables.
What AOMAN C1 and C2 Pro Do Differently
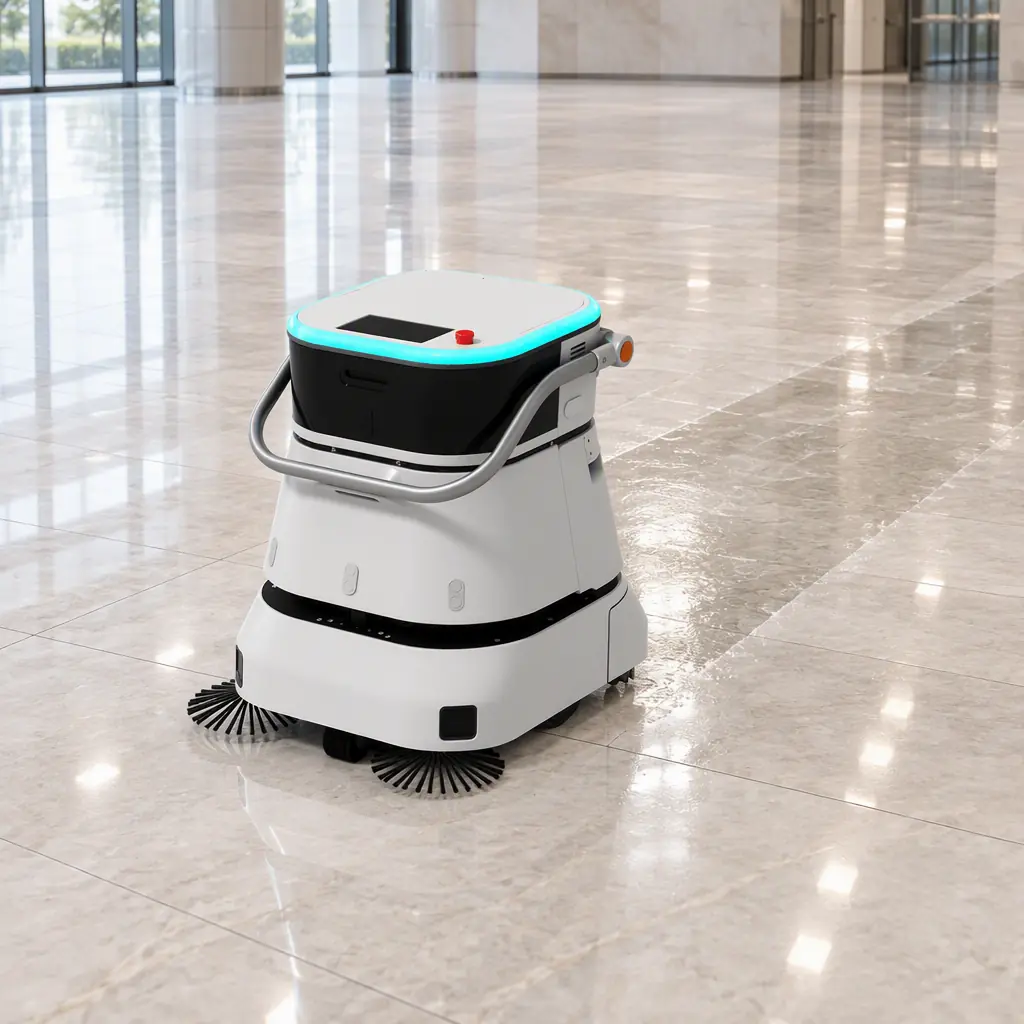
The AOMAN cleaning range approaches solution handling as a measurable duty cycle. The C1 large-format scrubber carries a solution and recovery tank pair sized for continuous production coverage on large floors, with an electrically metered chemical injection point rather than a manual pour, so the dilution ratio set at commissioning is the ratio the machine actually uses on every subsequent pass. The C2 Pro compact cleaner follows the same architecture at a smaller tank volume, which suits multi-zone sites where a single large machine would be inefficient between short runs.
The honest limitation is on the recovery side. The water lifted back into the recovery tank has to be disposed of somewhere, and at large sites that means either a floor drain, a service sink, or a manual dump cycle. AOMAN does not eliminate that handling step, and any vendor claiming a fully closed water loop on a floor scrubber is describing something the physics does not currently support at production scale. What the machine does is make the volume predictable, so the disposal route can be planned at a known volume rather than discovered at an unknown one. Sites treating the dump as a plumbing afterthought are the ones that end up with a mid-shift problem.
The other dimension that changes water consumption in real deployments is scheduling. Cleaning the same floor more often than it needs cleaning is a straightforward consumption multiplier, and the zone-level reporting on the AOMAN platforms makes the actual interval visible rather than assumed. That connects directly to the measurement framework in service robot KPI benchmarks, where coverage and utilisation are defined so that cleaning frequency can be justified rather than inherited from the manual schedule.
Building the Water and Chemical Line Into Your Budget
The following produces a defensible figure in an afternoon, using instruments you already have.
- Meter area per fill on your own floor. Fill the tank, run a normal pass, and record the area covered before the low-level alert. Datasheet coverage figures assume ideal conditions.
- Record fills per shift, not tank size alone. Tank capacity sets the volume; fills per shift sets the frequency.
- Photograph the dosing setting. Capture the actual injector setting or dilution ratio at commissioning, and re-check it at each service visit.
- Use your own unit prices. Water is billed per cubic metre and concentrate per litre; both vary enough by region that published figures are unreliable.
- Extend to the site, not the fleet. Compute cost per 1,000 m² once, then multiply by area and frequency for each site in the programme.
- Track consumption monthly against the model. A drift above roughly 15 percent signals a dilution change, a surface change, or a machine fault, and is worth investigating before it compounds.
- Plan the recovery-water route. Decide where recovered solution goes and at what volume, before the fleet arrives.
Run that once and the water and chemical line stops being an unmodelled assumption. It becomes a number with a source, a method and a variance, which is exactly what it needs to be to survive a finance review. For the labor side of the same budget compare against the cleaning robot labor cost model, and for the capital and service components see maintenance and total cost of ownership. If you want AOMAN to meter area-per-fill against your own floor during a trial, request a consumption assessment and we will report water and chemical per 1,000 m² for your site specifically.