
Service Robot Fleet Energy Audit
At a glance: A robot fleet is usually bought on labour savings and then quietly spends five figures a year on electricity that nobody modelled. The audit that fixes this is not a sustainability exercise: it is a tariff review, a load-shape review and a grants review run on the same meter data, and it typically finds 15 to 35 percent of the fleet energy bill recoverable through scheduling, charger sizing and utility programmes. This guide sets out the five measurements the audit needs, the hourly load profile of a real fleet, where the money actually sits, and how to write the audit into an RFP so the vendor has to supply the data.
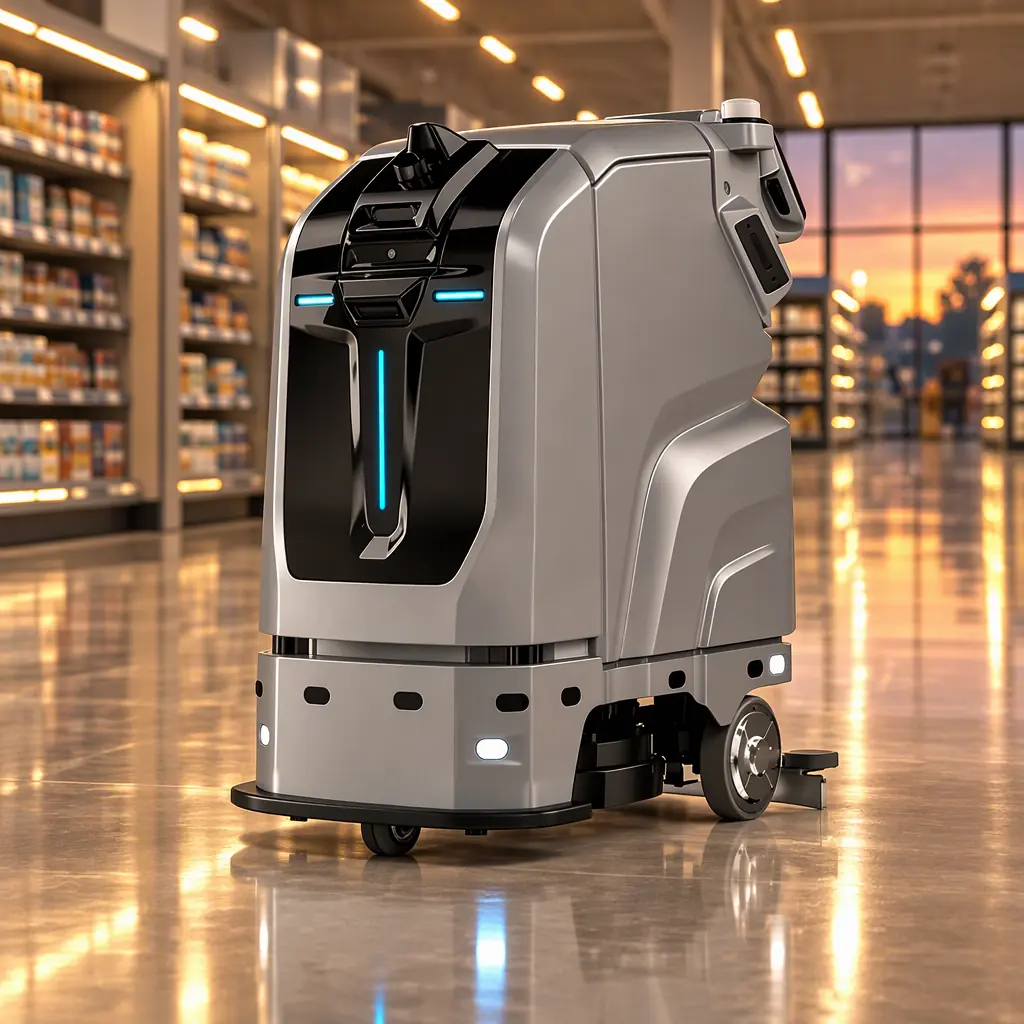
Why a Robot Fleet Deserves Its Own Audit
Most buildings already have an energy story. The robot fleet is the part of that story that arrived after the last audit was done, and it behaves differently from everything else on the meter. A cleaning fleet charges in blocks at shift change. A delivery fleet trickles all day between runs and pulls hard in the late afternoon. A patrol fleet charges overnight and is the only load awake at 03:00. None of that looks like an HVAC load, and none of it is captured by a building-level monthly bill.
The second reason is that the fleet is a controllable load in a way the building is not. You cannot reschedule a chiller because the tariff changes at 17:00. You can reschedule a scrubber, and the robot does not notice. That controllability is worth money, but only if the operator knows the fleet's load shape well enough to move it deliberately instead of accidentally.
The third reason is commercial. Utility efficiency programmes, grant schemes and tax treatments are written around documented baseline consumption. An operator who can produce a metered pre-installation and post-installation baseline has a claim; an operator who says "we think we saved about 20 percent" has none. The audit is the claim's evidence file, and it is the same file the sustainability team needs when it reports the fleet under Scope 2, covered in the ESG reporting framework guide.
The Five Measurements an Audit Actually Needs
An energy audit of a robot fleet can be done with five data streams, and four of them probably already exist somewhere in the building. The mistake is to start with a spreadsheet of nameplate wattages and multiply, which produces a number that is wrong in both directions: it ignores charging losses and it ignores the fact that a robot is idle most of the hours you are counting.
| Measurement | Source | Interval | What it answers |
|---|---|---|---|
| Fleet energy draw | Charge-dock sub-meter or per-dock energy field in the fleet software | 15 minutes | Total kWh the fleet actually consumes, including charging losses |
| Charging events | Fleet software event log | Per event | How many sessions, their start time, duration and energy delivered |
| Robot duty state | Fleet software task log | Per task | Time cleaning, time delivering, time idle, time charging |
| Site tariff | Utility bill plus the meter's rate schedule | Monthly, with the tariff's own period definitions | What each kWh and each peak kW costs at the hour it occurs |
| Peak demand | Utility interval data (usually 15 or 30 minute) | 15 or 30 minutes | The kW billed on the demand line, and whether the fleet sets it |
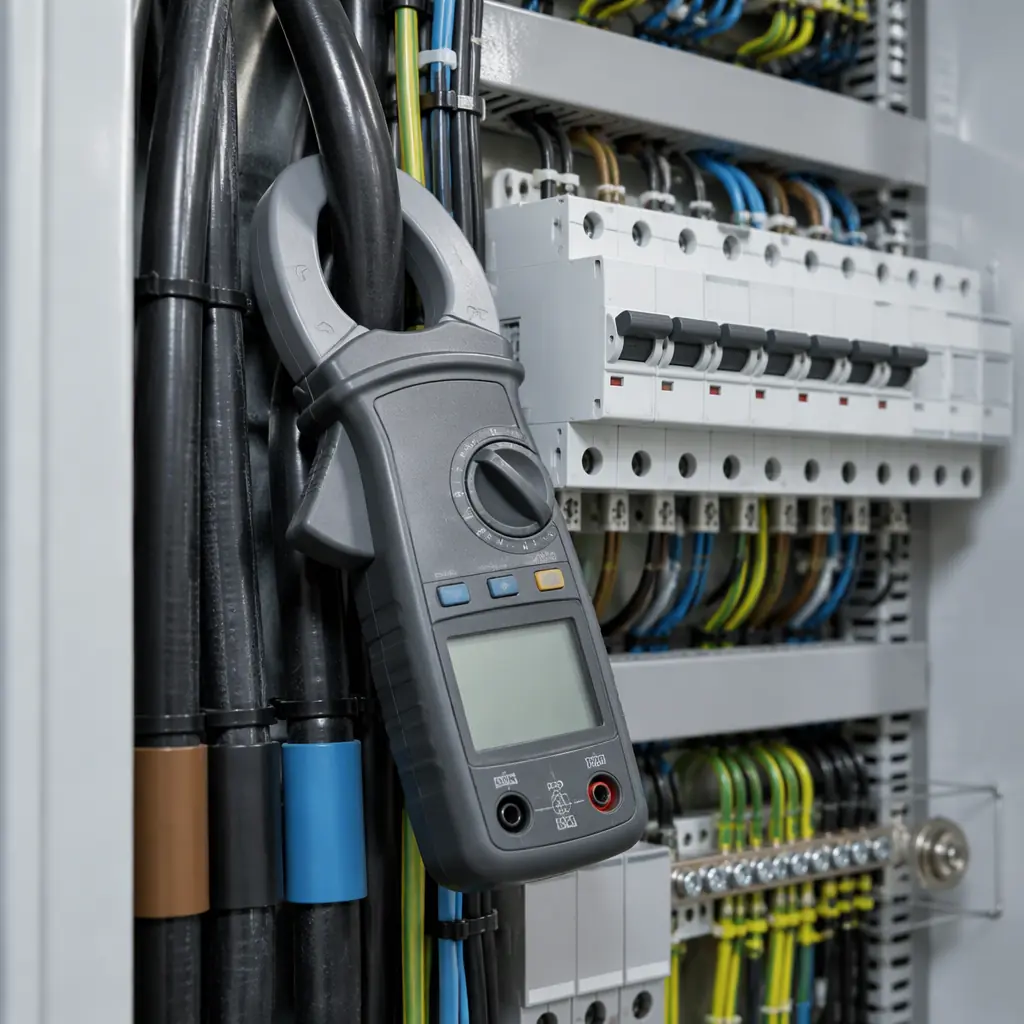
Two of those five are frequently missing. The sub-meter is the one that matters most, and it is also the cheapest to add: a clamp meter on the charge-dock circuit for a fortnight gives a usable baseline, and a permanent meter costs less than a single month of a mid-size fleet's demand charge. If the docks cannot be metered separately because they share a panel with other loads, put a meter on the panel and subtract the known loads, or ask the vendor for per-dock energy from the fleet software, which most 2025-and-later platforms already log.
Load Profile: What a Fleet's Day Really Looks Like
The single most useful output of the audit is an hourly load profile, because it shows immediately whether the fleet is charging when energy is cheap or when it is convenient. The table below is a representative shape for a 12-robot cleaning fleet on a single-shift contract with an overnight deep clean, normalised so the peak hour equals 100. It is not a universal figure; it is the shape to expect, and the audit's job is to produce the site's own version of it.
| Hour | Fleet load (index, peak = 100) | What is happening |
|---|---|---|
| 00:00 to 05:00 | 70 to 85 | Overnight deep clean running; robots rotate through docks |
| 05:00 to 07:00 | 35 | Final charge before the shift, plus dock top-ups |
| 07:00 to 09:00 | 20 | Morning shift start, robots leaving, docks idle |
| 09:00 to 12:00 | 55 | Daytime cleaning with rotating mid-shift top-ups |
| 12:00 to 14:00 | 65 | Peak footfall, heaviest cleaning, most frequent top-ups |
| 14:00 to 17:00 | 45 | Afternoon cleaning, some dock time |
| 17:00 to 19:00 | 90 | Shift change plus evening cleaning; often the true peak |
| 19:00 to 22:00 | 100 | Evening activities, all robots out, docks charging in parallel |
| 22:00 to 24:00 | 75 | Overnight clean begins |
The pattern to look for is the evening block. On this shape the fleet's true peak lands between 19:00 and 22:00, which on many commercial tariffs is still inside a peak or mid-peak window, and it lands at almost the same time as the building's own evening load. A fleet that charges 12 robots in parallel for three evening hours is a fleet that has built a demand spike out of convenience. Splitting the same energy across the overnight window often removes the spike entirely at no operational cost, because the robots are parked anyway.
Where the Savings Actually Are
Audit findings sort into a consistent order of size. The list below is ranked by typical recoverable cost for a 10 to 20 robot fleet, with the arithmetic that makes each finding worth chasing. Figures are per-fleet annual, and they scale roughly linearly with robot count until the site's demand plateau is hit.
- Demand-charge reduction by scheduling, the largest single item. If the fleet is 12 robots charging at 1.8 kW average during a three-hour evening block, that block is about 65 kW of fleet load. Removing it from a demand window billed at 15 USD per kW per month removes up to 975 USD per month, or 11,700 USD a year, before any energy is saved. The bill mechanics behind that number are set out in the demand charge and peak-load guide; the audit's contribution is proving the fleet sets the peak.
- Charger sizing. Oversized docks charge faster than the duty cycle requires, and fast charging costs more in conversion losses and in the peak it creates. Right-sizing to the actual turnaround need typically cuts charging loss by a third.
- Rotation instead of parallel charging. Charging four robots sequentially uses one quarter of the instantaneous load of charging four in parallel, and for an overnight window that is usually enough. This is a software setting, not a hardware purchase.
- Idle draw. Robots parked with screens on, lidar spinning and docks energised pull a small but permanent load. On a 15-robot fleet, 40 W of idle draw per robot is 5.3 MWh a year, which is a real line on the bill and is usually reduced with a sleep profile.
- Tariff re-selection. Once the load shape is known, the site can test whether a different tariff structure (time-of-use, or a demand ratchet with a lower energy rate) is cheaper for this particular shape. This is a comparison the operator can only run with the audit's data.
The energy itself is the smaller half of the story. On the fleet shape above, the total energy is modest; a 12-robot cleaning fleet running two shifts consumes roughly 25 to 40 MWh a year, which at 0.20 USD per kWh is 5,000 to 8,000 USD. The demand line and the tariff choice are where the recoverable money sits, which is why an audit that only counts kWh misses most of the opportunity.
Utility Programmes That Pay for Part of It
Efficiency programmes are local by definition, so the audit should map the site to whatever its utility and jurisdiction actually offer rather than assume a national scheme. The categories below cover most of what a commercial robot fleet can claim in 2026, with the evidence each one demands.
| Programme type | What it funds | Evidence it demands | Fit for a robot fleet |
|---|---|---|---|
| Prescriptive custom-measure rebate | A fixed amount per kWh saved, or per unit installed | Metered baseline and post-installation data, equipment invoice | Good, if the fleet replaces a manual machine with a measured duty cycle |
| Custom efficiency incentive | Per-kWh-saved payment based on an engineering calculation | Pre/post measurement plan, often 12 months of data | Best fit for scheduling and charger right-sizing measures |
| Demand-response programme | Capacity payment, sometimes an availability payment | Ability to curtail a defined kW within a notice window | Good where the fleet can defer charging by 30 to 60 minutes |
| Managed charging or load-shift pilot | Incentive plus a control system | Interval data and a controllable charging interface | Only where the fleet software exposes a charging schedule API |
| Tax incentive or accelerated depreciation | Reduced tax rather than a cash rebate | Asset register and capitalisation records | Applies to the whole asset, not the energy measure |
Two cautions. First, a rebate computed on kWh saved will value a scheduling change at zero, because scheduling moves energy rather than reducing it, so the demand-side measures need a demand-response or custom programme, not a prescriptive one. Second, most programmes require the measure to be additional to code or standard practice; a fleet that was always going to be installed may fail that test unless the efficiency element is separately documented. The audit is what produces that documentation.
Building the Audit Into the RFP
The audit is far cheaper if the vendor supplies the data as a contractual obligation rather than as a favour after the sale. Four clauses do most of the work, and they cost nothing at tender stage because the platform either has the data or it does not.
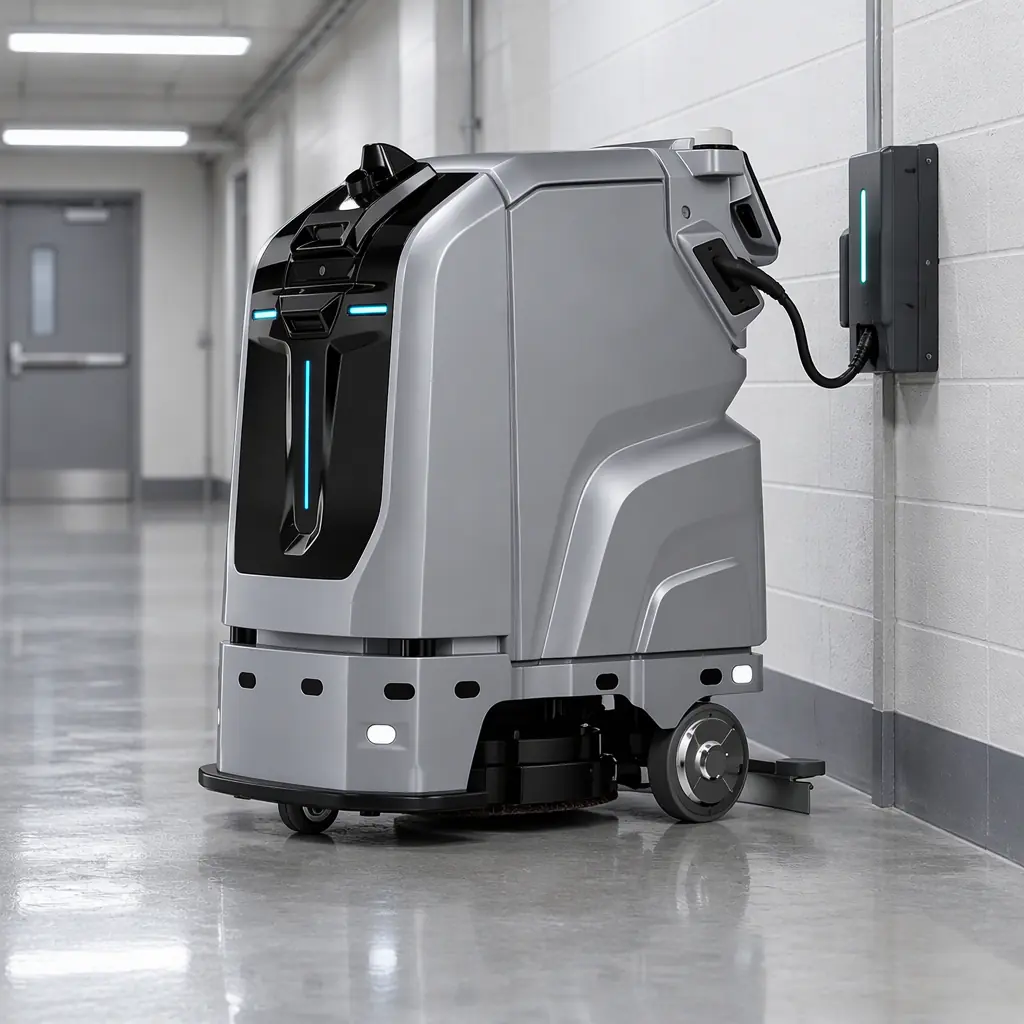
Require per-dock energy metering, in kWh, at 15-minute resolution, exportable as CSV or through an API without a professional-services fee. Require a task-level state log so cleaning, delivery, idle and charging time can be separated. Require a charge-schedule interface that the operator can configure per dock, including a start and stop window and a maximum concurrent-dock count, because a platform that only offers "charge when docked" cannot be scheduled and therefore cannot capture the demand savings. And require a documented data-retention period of at least 24 months, since efficiency programmes and audit cycles both run longer than a single year.
If the platform already integrates with building systems through Modbus or a documented API, the audit data can land in the same dashboard the facilities team already reads, which removes the recurring cost of pulling it manually. The integration patterns for that are covered in the occupancy sensor and BMS integration guide, and the charging hardware side in the charging infrastructure power planning guide.
Commissioning the Audit Step by Step
A fleet audit can be completed in three weeks if the data streams exist, and in six if the sub-meter has to be installed. The sequence below is the one that avoids the common failure of producing a report nobody can defend. Before any of it, run the readiness review in the site survey and readiness assessment guide, because an audit on an unmetered site with no task log is a different project.
Week 1, baseline. Meter the dock circuit, export 30 days of fleet software data if it exists, and collect 12 months of utility bills including the interval data file. Do not change anything during this window, including charging schedules, or the baseline is contaminated.
Week 2, profile and attribution. Build the hourly profile, then determine which peaks the fleet actually sets by comparing fleet load to the site's total interval load at each peak. A peak where the fleet contributes less than 15 percent of site load is not a fleet problem and should not be in the fleet's savings claim.
Week 3, measures and claim. Model the scheduling, rotation and right-sizing changes against the profile, price them against the actual tariff, and map them to programmes. Then implement the schedule change first, because it is free and its effect is visible within a week, and re-meter to confirm before submitting any programme application.
The output file should hold four things: the 12-month baseline, the hourly profile, the measure list with modelled savings and cost, and the programme mapping. That file is what makes the next renewal cycle cheap, because the following year's audit is an update rather than a fresh start.
Frequently Asked Questions
How much does a robot fleet actually cost to run in electricity?
For cleaning and delivery fleets in commercial buildings, energy consumption typically lands between 2 and 4 MWh per robot per year at two-shift utilisation, which is roughly 400 to 800 USD per robot per year at 0.20 USD per kWh. The demand charge the fleet attracts can exceed that figure, which is why the audit looks at both.
Do we need a separate utility meter for the robots?
Not necessarily, but you need interval data attributable to the fleet. A clamp meter and logger on the dock circuit for a fortnight is enough to build a baseline, and a permanent sub-meter is worth it once the fleet passes roughly ten robots. Panel-level metering with subtraction works when the dock circuit cannot be isolated.
Can charging be moved off-peak without hurting readiness?
Usually yes, because robots are parked longer than they charge. The constraint is the worst shift turnaround, not the average, so the schedule should be built around the tightest back-to-back duty cycle on the site. The energy and route optimization guide covers how to align charging with task scheduling.
Which single change gives the fastest payback?
The charge-schedule change. It has no capital cost, is configured in the fleet software, and shows up on the next bill. It is also the measure most likely to be excluded from prescriptive rebates, so pair it with a demand-response enrolment if the utility offers one.

Get a Quote
Tell us about your space and workload, we reply within 24 hours.