
Delivery Robot Payload Capacity: The Fleet-Size Arithmetic

Why Payload Is the Wrong Unit on the Datasheet and the Right Unit on the Budget
Every delivery robot datasheet leads with payload, and almost every buyer misreads it. A 40 kg figure is not capacity in the sense a warehouse manager understands capacity. It is the maximum mass the chassis can carry on one outbound trip, and the moment you convert it into trips per shift you find that the number which actually sets fleet size is not payload at all. It is the ratio between what a building moves in a day and what one trip can carry, and that ratio is dominated by three things that have nothing to do with the load rating: the length of the round trip, the hours the routes are usable, and the size of the items rather than their mass.
This article sets out the arithmetic properly, using a real chassis as the worked input. The unit is the AOMAN D1, which carries 40 kg across four detachable 10 kg tray positions inside a 1,265 by 484 by 551 mm body, moves at 0.3 to 1.0 metres per second, clears a 650 mm aisle, climbs a 15 mm step and a 5 degree slope, and runs about 8 hours on a 20 Ah LiFePO4 pack with a 4 hour charge. Those figures are enough to build the model, and the model is the same for any unit you are comparing.
The conclusion most buyers reach after running it is uncomfortable for suppliers: in the majority of single-building deployments under about 60 deliveries a day, payload rating is not the constraint. Trip length is. And in the minority of cases where payload genuinely binds, the answer is usually a bigger cabin rather than more units, which is a completely different purchasing conversation.
The Trip-Cycle Model: Four Time Segments That Make Up One Delivery
Fleet size follows from the cycle time, not from the payload. One completed delivery is the sum of four segments, and each has to be measured on site rather than quoted.
- Load time. Placing items on trays, confirming the destination on the control screen, and closing the cabin. For a four-tray configuration this is 60 to 110 seconds for a practised dispatcher, and closer to 3 minutes in the first weeks when staff are still learning the sequence.
- Outbound travel. Distance divided by the effective speed. Effective speed is not the 1.0 m/s headline. In a serviced office floor with people, doors and a lift lobby, 0.55 to 0.7 m/s is realistic, and a lift wait adds 20 to 90 seconds per floor change.
- Handoff. The receiving end is the segment everyone underestimates, because the person who ordered the item is usually not standing at the door. A passcode collection is 20 to 40 seconds. A handoff that requires a phone call to a recipient who is in a meeting is 3 to 8 minutes, and that entire time the machine is idle with a load aboard.
- Return. The empty trip back to the dock or the dispatch point, at slightly higher speed since there is no load and no recipient to wait for.
A typical office-floor delivery with one lift change: 90 seconds load, 210 seconds outbound, 45 seconds handoff, 150 seconds return, plus 30 seconds of margin. That is 525 seconds, or 8.75 minutes per completed delivery. A machine that runs 8 hours a day has 480 minutes, of which perhaps 85 percent is genuinely available after charging, cleaning, fault recovery and route-map maintenance. That leaves 408 productive minutes, which is 46 deliveries per machine per day at that cycle time.
Now change one variable. Make the building 40 percent longer or add two lift changes and the cycle rises to about 12 minutes, which drops the same machine to 34 deliveries a day. Nothing about the payload changed. The fleet requirement moved by a third.
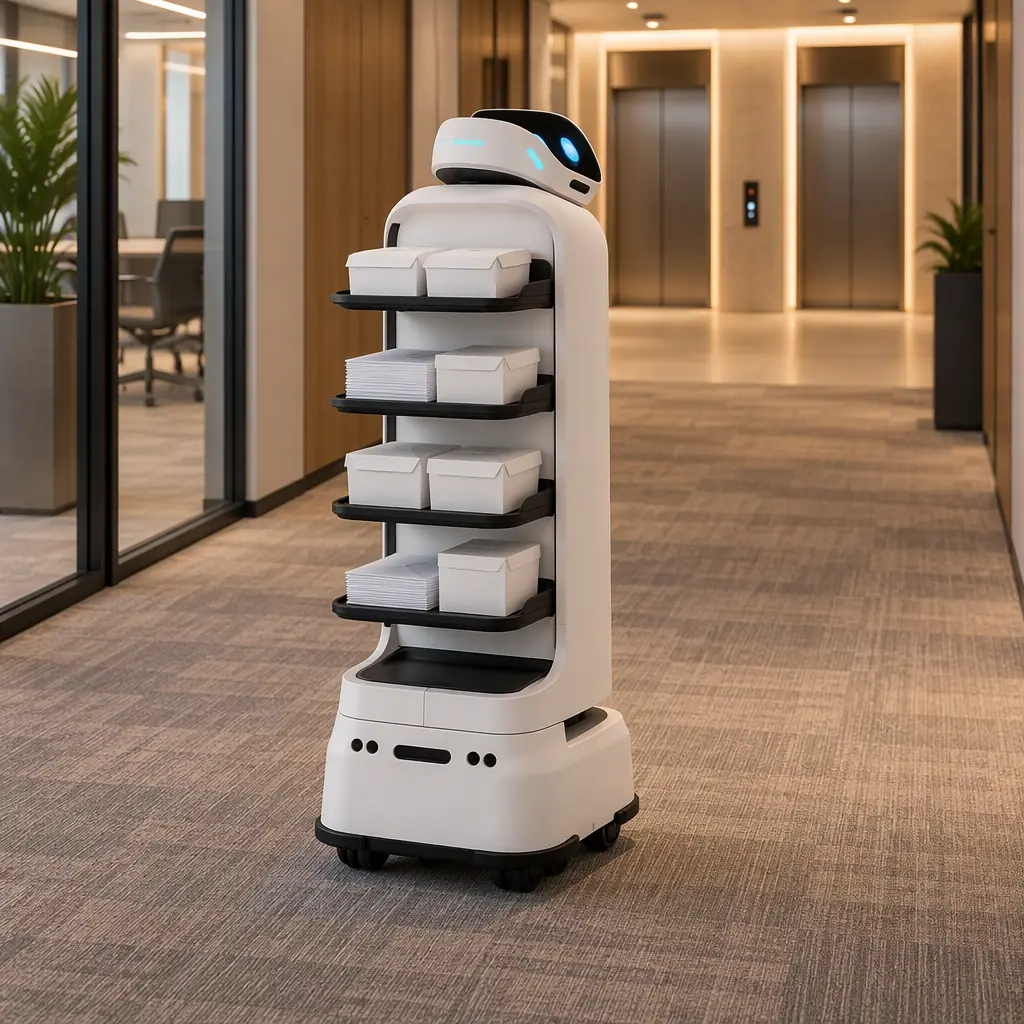
Converting Deliveries into Units: The Formula
With the cycle time established, fleet sizing is a division with a rounding decision attached.
| Step | Formula | Worked example |
|---|---|---|
| Daily demand | Count of dispatch requests per day, including internal mail, documents, catering and inter-department parcels | 120 requests per day |
| Productive minutes per unit | Shift length in minutes minus charging, cleaning and recovery allowance | 480 minus 15 percent = 408 minutes |
| Cycle time | Load plus outbound plus handoff plus return, measured on site | 8.75 minutes |
| Capacity per unit | Productive minutes divided by cycle time | 46 deliveries per day |
| Theoretical units | Daily demand divided by capacity per unit | 2.6 units |
| Fleet with demand smoothing | Theoretical units rounded up, plus one if demand has a peak window | 3 units, and 4 if the whole load arrives between 11:30 and 13:30 |
The last row is where most business cases fail. Deliveries are never uniform across the day. Catering, courier arrivals and inter-office mail all cluster, and a fleet sized on the daily average will queue badly at exactly the hour when the service is most visible. The practical rule is to model the peak two-hour window separately: if 45 percent of daily demand lands in a single 120 minute block, the fleet has to be sized on that block, not on the average. In the example above that means four units covering 54 deliveries in 137 productive minutes, which is three machines running flat out plus one buffering, not the three the average suggested.
For the throughput side of the same arithmetic, including how to measure cycle time on a site survey rather than guessing it, the method in deployment throughput planning applies directly.
When Payload Actually Binds: Three Situations
Payload matters in a narrower set of conditions than suppliers imply, but in those conditions it dominates everything else.
Mass-dense loads. Catering is the classic case. A 40 kg rating sounds generous until you load 30 boxed lunches at 700 g each, add the insulated carriers, and discover the four trays are full at 24 kg while a fifth of the volume is still empty. Bottled water, printed material and event catering all hit mass before they hit volume. Anything averaging above 300 g per item belongs in a mass-limited model.
Single-item oversize. A laptop trolley, a projector case or a long parcel can be under 10 kg and still not fit, because the constraint is tray geometry rather than weight. The D1 body is 484 mm wide and 551 mm deep, so a padded case of 620 mm is a non-starter regardless of mass. Measure the longest item in the demand profile before the load rating.
Long round trips. In a distribution centre or a campus with a 900 metre one-way route, the cycle time is so long that carrying more per trip is the only way to keep the unit count sane. Doubling effective payload from 20 to 40 kg on the same chassis cuts trips in half without touching the fleet, and that is where a high payload figure genuinely earns its price.
The reverse case matters just as much. In a single floor of an office building with 40 daily requests, a 15 kg unit with a good lift integration will outperform a 40 kg unit with no lift interface, because the second machine spends its day waiting at the lift. Payload is one line in the specification and lift behaviour is another, and the second one is more often decisive. See elevator integration for multi-floor deployments for what that interface has to do.
Payload to Fleet Curve: Where the Second Machine Stops Paying
The relationship between payload and required fleet is not linear and it flattens in a way that is easy to miss in a spreadsheet. Take a fixed daily demand of 120 deliveries at 700 g average, and vary the usable payload of the chosen unit.
| Usable payload per trip | Trips needed if mass-limited | Trips needed if volume-limited (4 trays, 1.5 items per tray) | Units required at 8.75 min cycle |
|---|---|---|---|
| 10 kg | 9 per wave, 2 waves | 6 items per trip, 20 trips | 4 |
| 20 kg | 5 per wave | 6 items per trip, 20 trips | 4 |
| 30 kg | 4 per wave | 6 items per trip, 20 trips | 3 |
| 40 kg | 3 per wave | 6 items per trip, 20 trips | 3 |
The middle column is the one that should change how you buy. Once the load is volume-limited rather than mass-limited, doubling payload buys nothing, because the cabinet still holds six items. This is the single most common specification error in delivery robot procurement: teams pay for mass rating when the constraint is tray count and tray shape. The fix is a configuration decision, not a chassis decision, which is why flexible tray systems matter more than headline kilograms.
The honest consequence is visible in the last column. Between a 30 kg and a 40 kg unit on this profile there is no fleet difference at all, so a 33 percent payload premium buys zero capacity. It only becomes worth paying when the demand profile is mass-dense, when the routes are long, or when a single-item oversize requirement forces the larger body.
Uptime, Charging and the Real Daily Ceiling
The 46 deliveries per machine figure assumes the unit is available for its full shift, and battery behaviour decides whether it is. A 20 Ah pack giving roughly 8 hours of runtime against a 4 hour full charge means a machine asked to run a 12 hour service window will stop once, and the stop is not free: the dock has to be reachable, the machine has to leave the route, and if the dock sits in a back-of-house location behind a locked door, someone has to be available to open it.
Three practical consequences follow, and all three are scheduling decisions rather than purchasing ones.
- Opportunity charging beats full cycling. A 25 to 30 minute top-up during the quiet midday window, if the machine happens to be near the dock, buys 2 to 3 hours of running. Whether the software supports partial charging on demand is a question worth asking before purchase.
- Dock placement sets the ceiling. One dock per two machines is the usual minimum, positioned where the machine naturally returns rather than where the power point happens to be. A dock 90 seconds off-route is a dock that gets skipped.
- Charging is not the only downtime. Tray washing, cabin wipe-down and fault recovery all consume productive minutes. Allowing 15 percent of the shift for non-delivery activity is a realistic planning assumption, and if the building has a catering operation the tray wash alone will exceed it.
The charging infrastructure question gets a fuller treatment in fleet charging infrastructure and power planning, including the circuit capacity arithmetic that facilities teams tend to leave until the machines arrive.
Payload Limits as the Route-Design Constraint Nobody Tests
A loaded machine behaves differently from an empty one, and the specification that changes most is slope. The 5 degree limit on a D1 is a rated figure under load, and 5 degrees is steeper than it sounds: a 1:11 ramp is 5.2 degrees, which is close to the maximum gradient permitted for an accessible route in many jurisdictions. A loading bay ramp at 1:8 is 7.1 degrees and is out of specification loaded, whatever it does empty.
Three route features need checking with the machine loaded, not on a walkthrough:
| Route feature | Rating to check | Failure mode if exceeded loaded |
|---|---|---|
| Ramp between levels | 5 degree slope, 1:11 | Machine stalls or reverses at the top of the ramp with a full load; drivers learn to under-load it |
| Door thresholds and lift sills | 15 mm step | Front wheel rides up, tray contents shift, trays must be re-seated at every threshold |
| Threshold plates and cable covers | 15 mm step, but also 650 mm aisle width | A 40 mm cable cover is a hard stop; a 700 mm gap between a plate and a wall traps a 484 mm body with 108 mm clearance each side |
| Kerb at a loading point | 15 mm, 5 degrees | Outdoor-to-indoor transitions are the single most common failed route in survey |
The 650 mm aisle figure is worth dwelling on because it is often read as generous. A 484 mm body in a 650 mm aisle leaves 83 mm each side, which is fine for a straight run and inadequate for a turn. Any route that requires a 90 degree turn needs the turning circle measured, and the survey method in site survey and readiness assessment covers exactly this.
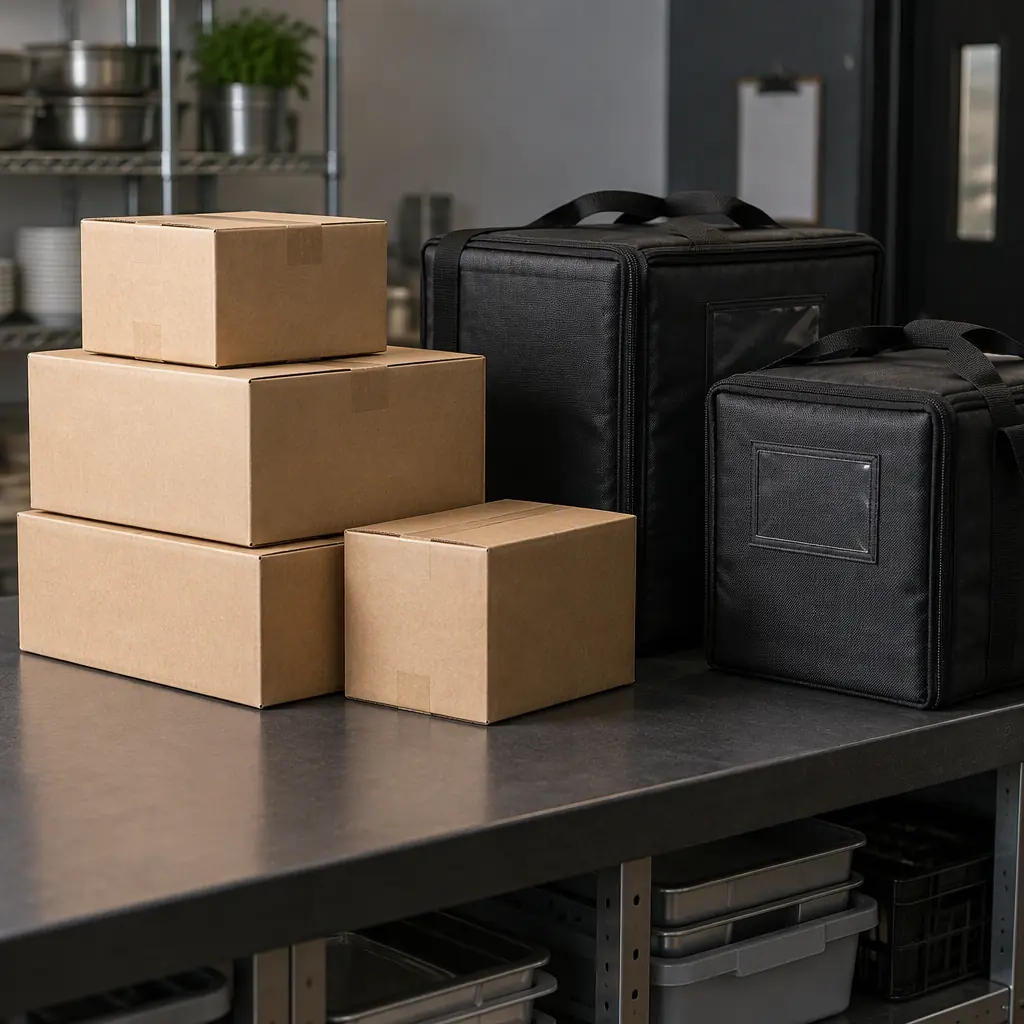
Worked Case: 120 Deliveries a Day in a 6,400 Square Metre Office Building
Assemble the model on a realistic property to see where the answer lands. This is a multi-let office tower, so the fleet decision and the question of who ultimately pays for it are connected; the apportionment arithmetic is set out in robot service charge allocation for multi-tenant buildings.
| Input | Value | How it was established |
|---|---|---|
| Daily dispatch requests | 120 | Two weeks of reception logs, mail, courier and internal parcel requests |
| Average item mass | 700 g | Sample weighed at reception across one week |
| Items per trip, volume-limited | 6 | Four trays at 1.5 items average, measured not assumed |
| Round trip, including one lift change | 8.75 minutes | Timed with a stopwatch on three routes |
| Peak window share | 45 percent in 120 minutes | Log timestamp distribution |
| Service hours | 08:00 to 18:00 | Building management |
At six items and 8.75 minutes the machine returns 20 deliveries in a 175 minute window, so the 54-delivery peak needs three machines working and one buffering. Off-peak the same three machines run at a third of capacity, which is the honest cost of demand smoothing and the reason some operators restrict the service to the peak and use staff for the tail.
The load arithmetic confirms the earlier point. 120 deliveries at 700 g is 84 kg a day in total, spread over 20 trips or about 4.2 kg per trip. The 40 kg rating is used at barely a tenth of its capacity, and a smaller chassis with the same tray geometry would deliver identical throughput. The purchase should therefore be justified on durability, lift integration and tray configurability, not on payload, and saying so explicitly is what makes the capital request defensible.
Where a property genuinely needs the larger cabin is a mixed-use building with a catering operation attached. A single 180-meal service at 650 g per meal plus carriers is 130 kg of moving cargo, which cannot be done in six-item trips without holding food at temperature on a landing. That is the case for a high-payload unit, and it is a catering case rather than a general delivery case.
What to Ask Before You Settle the Fleet Size
- What is the usable payload, not the rated payload? Ask for the payload with the tray configuration you will actually buy, and ask what the tray wash time is, because trays that take 25 minutes to clean set your spare-tray count.
- Which constraint binds on our profile? Give the supplier your item count, average item mass and longest single item, and require an answer in trips rather than kilograms.
- What is the cycle time with a lift change? Not the average, the specific route with the lift wait included. Then multiply by your peak block, not your daily average.
- What does the machine do when a recipient does not answer? Timeout behaviour, return-to-dock policy and whether the load can be re-routed to another destination mid-trip determine whether your 8.75 minute cycle is real. Failure handling generally is covered in service robot failure modes.
- How is the fleet tested at acceptance? A factory test of one unit says nothing about four units sharing a lift lobby at 12:30. The gating sequence is in acceptance testing and commissioning.
- What does a second year cost? Batteries, trays and bumpers are consumable on a delivery unit that runs 20 trips a day, and the five-year ledger in total cost of ownership applies the same method to a different machine type.
A buyer who arrives with a cycle time, a peak block and an item census will get a fleet number that survives contact with the building. A buyer who arrives with a payload figure will get a quotation for the machine the supplier wanted to sell.