
Energy, Water and Detergent per Square Metre
At a glance: Most cleaning fleet business cases stop at labour and capital, which leaves the variable cost per square metre as an assumption nobody tests. Energy, water and detergent are small line items individually and a visible one in total, and they behave differently from labour: they scale with area cleaned, they move with the price of electricity and they are measurable from the robot's own telemetry. This guide gives the arithmetic, the levers that move the number, and the metering arrangement that lets the figure survive a contract renewal.
Why Per-Square-Metre Cost Matters More Than Per-Hour Cost
A cleaning contract is priced on area and delivered on area, so the variable cost that decides the margin is the cost per square metre, not the cost per robot-hour. Labour converts to a per-hour number because a cleaner is paid by the hour. Energy, water and detergent convert to a per-square-metre number because consumption follows the floor, not the clock. Mixing the two units is the most common reason a cleaning business case overstates the saving.
The scale is easy to underestimate. A mid-size retail site of 12,000 m² cleaned nightly consumes a few hundred litres of water and a few tens of kilowatt-hours of electricity per night, which is trivial against its labour line and visible against its consumables line. In a fleet of forty sites, though, the same figures become a five-figure annual line that a procurement team will ask about, and the operator who can produce a measured per-square-metre figure rather than an estimate wins the conversation.
There is a second reason to model it properly. Energy, water and detergent are the costs that a service provider can pass through or index, and the ones a client will challenge at renewal. An operator who can show a metered figure, with the levers held constant, has a defensible basis for an escalation clause. That is a commercial benefit, not an environmental one, and it is usually the argument that gets the metering approved.
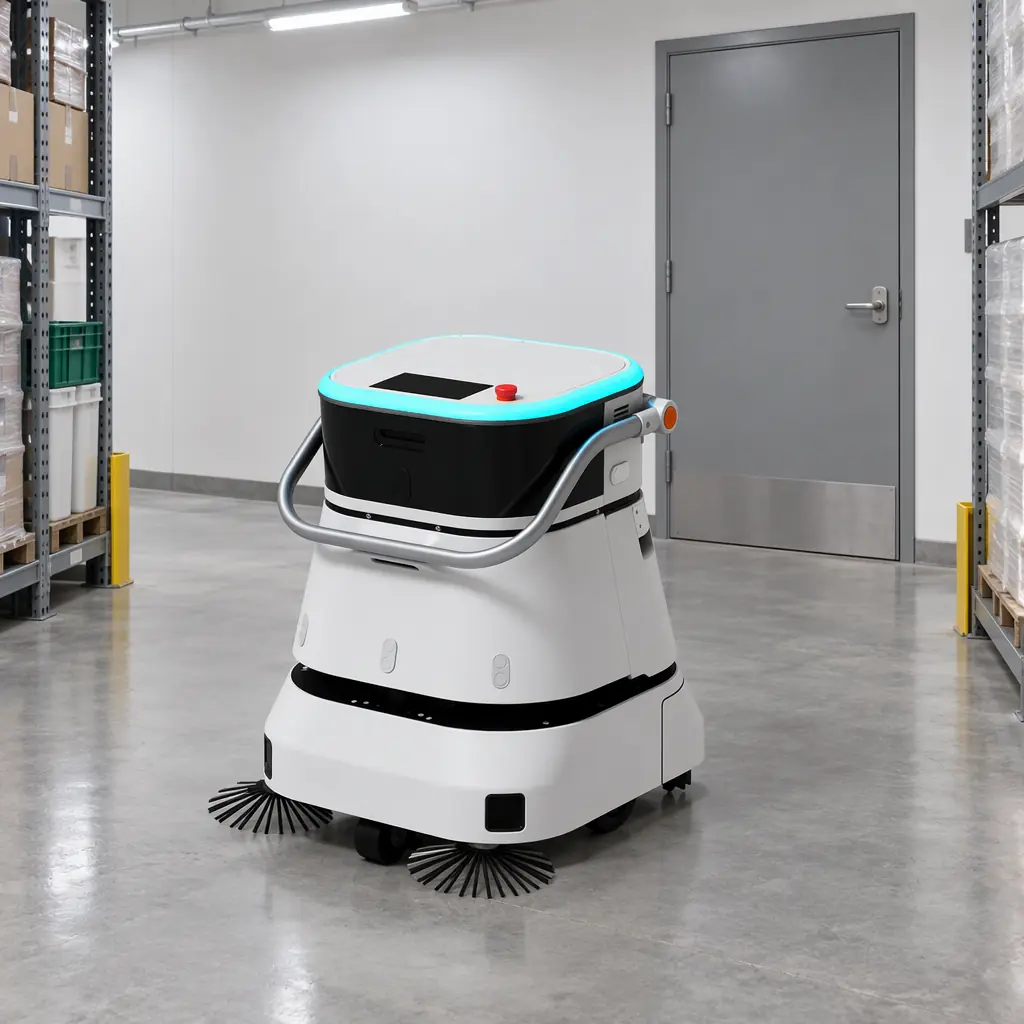
The Three Cost Lines and What Drives Each
Each of the three lines has a different driver, and conflating them produces a number that cannot be improved because nobody knows which lever to pull.
| Line | Primary driver | Secondary driver | What does not move it much |
|---|---|---|---|
| Electricity | Area cleaned and the mix of scrubbing, sweeping and vacuuming in that area | Travel distance between zones, dock efficiency, ambient temperature | Robot model alone, at comparable deck width |
| Water | Solution flow rate per square metre, set on the machine | Floor texture and soiling level, number of passes | Machine size |
| Detergent | Dilution ratio and dosing accuracy | Water hardness, which changes the effective dose | Water volume, if dosing is ratio-controlled |
The electricity figure is dominated by the cleaning work itself rather than by travel, which surprises operators who assume routing is the big lever. In a scrubber, the brush motors and the vacuum squeeze dominate the load; traction is a minority share except on long ramps. That means a route optimisation that saves ten percent of travel saves a percent or two of energy, while changing the brush pressure or the vacuum setting for a lightly soiled zone saves far more.
The Worked Per-Square-Metre Model
The model below is stated per 1,000 m² so it scales to any site. Numbers are typical for a mid-size scrubber on a hard floor with a single pass; the point is the structure rather than the exact constants, which should be replaced with the site's own metering in the first month.
| Item | Basis per 1,000 m² | Worked value |
|---|---|---|
| Cleaning productivity | Deck width and travel speed, with turns and doors | About 33 minutes at 1,800 m²/h |
| Average electrical draw while scrubbing | Brush motors, vacuum, traction, compute | About 620 W |
| Energy per 1,000 m² | 0.55 h x 0.62 kW | 0.34 kWh |
| Energy cost at 0.18 per kWh | Site tariff, all-in | 0.06 per 1,000 m² |
| Solution flow | Set rate, typically 0.3 to 0.6 litres per minute on a mid-size deck | About 18 litres per 1,000 m² |
| Water cost at 0.003 per litre | Supply plus disposal | 0.05 per 1,000 m² |
| Detergent at 1:200 dilution | 0.09 litres of concentrate per 1,000 m² | 0.05 per 1,000 m² |
| Total variable cost | Sum of the three | About 0.16 per 1,000 m² |
Read the total against the labour line and the reason the model matters becomes clear. A manual cleaner covering the same 1,000 m² costs tens of times more, so the variable cost is not the argument for robots. The argument for measuring it is that a five percent error in the labour productivity assumption is worth fifty times more than a fifty percent error in the variable cost, and operators routinely spend more energy arguing about the second. Get the labour number right first, then make the variable cost measurable so that a renewal conversation is about a documented figure rather than an estimate.
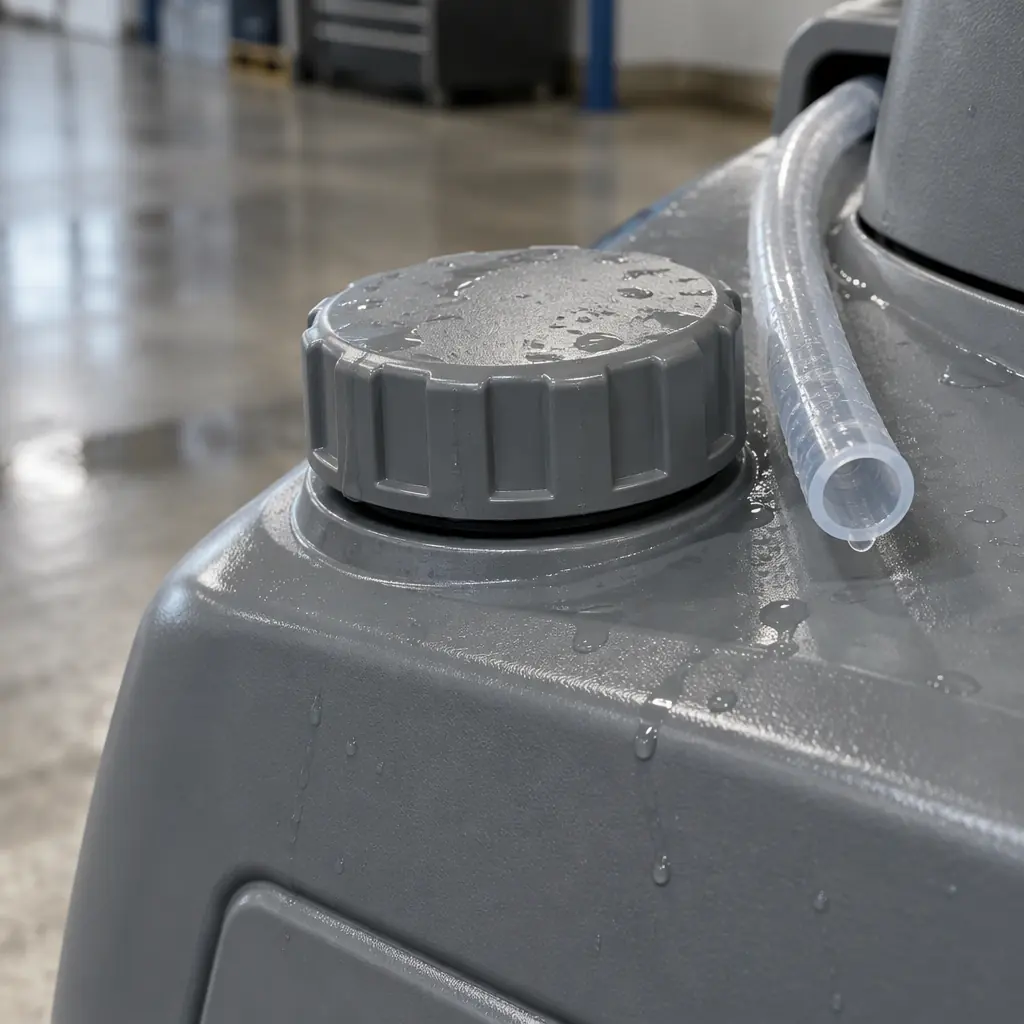
The Four Levers That Actually Move the Number
In a deployed fleet, four interventions move the per-square-metre figure. Three of them cost nothing.
- Solution flow rate. The single largest lever on the water line. A machine set to maximum flow uses roughly twice the water of one set to minimum for the same area, and on a sealed hard floor the visual result is often indistinguishable. Match the rate to the soiling class rather than leaving it at the factory default.
- Dosing accuracy. A dosing pump calibrated once and never checked drifts, usually upward, as the concentrate thickens with temperature. Check the delivered dose against the ratio quarterly, and check water hardness, because hard water needs more detergent for the same result and soft water needs less.
- Brush pressure and vacuum by zone. A zone that is swept daily needs less brush pressure and less vacuum than a loading dock. Zonal recipes cost nothing to configure and typically cut energy per square metre by five to ten percent across a mixed site.
- Pass count discipline. Two passes where one suffices doubles water, detergent and a large share of energy. A telemetry review of pass counts per zone usually finds at least one zone where a conservative setting has been left in place since commissioning.
The one lever that does cost money is deck width. A wider deck covers more area per pass, which lowers energy and water per square metre, but only if the site's aisles and door widths allow it. Sites constraining a wide machine to narrow routes lose the benefit and add travel. The sizing relationship between deck width, aisle geometry and unit count is covered in the throughput and fleet sizing guide, and the water and detergent mechanics in the water and detergent cost guide.
Metering: How to Prove the Number
An unmeasured per-square-metre figure is an estimate, and an estimate is what a client challenges at renewal. Three measurement points produce a defensible number without installing a building management system.
- Energy at the dock. A metered dock, or a plug-in energy monitor on the dock circuit, gives kilowatt-hours per charge. Divide by the square metres reported by the fleet layer for that charge. This is the number that matters, because it includes charging losses and standby draw, which a robot-side measurement misses.
- Water at the fill point. A pulse-output water meter on the fill line, or a simple totaliser read at each fill, gives litres per shift. Record the fills against the night's cleaned area rather than against the tank capacity.
- Detergent at the container. Weigh or measure the concentrate consumed per week and divide by weekly area. This catches dosing drift that a per-shift check would miss.
Three readings a week for a month is enough to establish the baseline with a usable confidence interval. After that, monthly readings are enough to detect drift. The measurement arrangement belongs in the fleet contract, because the operator needs the right to read it and the client needs to know it is read. The access clauses that cover this are the same ones discussed in the battery telemetry data contract guide, and the tariff side of the energy line is covered in the electricity cost guide.
Indexing the Line in a Service Contract
Once measured, the variable cost belongs in the contract as an indexed line rather than a fixed allowance. The structure that works is a per-square-metre rate, reviewed annually against the published electricity and water tariffs, with the consumption basis fixed at the measured baseline.
- Fix the consumption basis, index the price. The operator controls consumption, so the contract should fix litres and kilowatt-hours per square metre at the measured baseline, with a tolerance band, and let the unit price move with the tariff. That separates a change the operator caused from a change the market caused, which is exactly the distinction a renewal argument needs.
- Put the tolerance band in writing. A ten percent band either way is typical and prevents a conversation about normal seasonal variation. Movements beyond the band need a stated cause, such as a change of floor covering or a new zone.
- Report quarterly, not annually. Quarterly reporting turns the number into an operational metric rather than a year-end surprise, and it gives the operator a reason to catch dosing drift early.
- Exclude one-off deep cleans. A periodic deep clean uses multiples of the nightly water and detergent, and it distorts a per-square-metre average if it is not reported separately.
The commercial effect is modest in absolute terms and disproportionate in negotiation. An operator who arrives at a renewal with a metered baseline and a documented tolerance band is discussing a price adjustment; an operator who arrives with an estimate is defending the whole number.
Where AOMAN Fits
AOMAN builds the C1 large-format scrubber, the C2 Pro compact cleaner, the D1 delivery platform and the G1 reception platform, and quotes the cleaning platforms with the dock and the fleet layer that report consumption alongside mission data. Buyers who are building a multi-site contract can request the per-square-metre consumption basis for each platform on their own floor mix, and can specify the metering interface as part of the dock rather than adding it later. The company supports OEM and ODM programmes where the metering data model is agreed at design stage, which is cheaper than retrofitting a reporting interface into a fleet that is already in service. Platform specifications are on the products page, and the fleet and telemetry architecture is described on the technology page.

Get a Quote
Tell us about your space and workload, we reply within 24 hours.