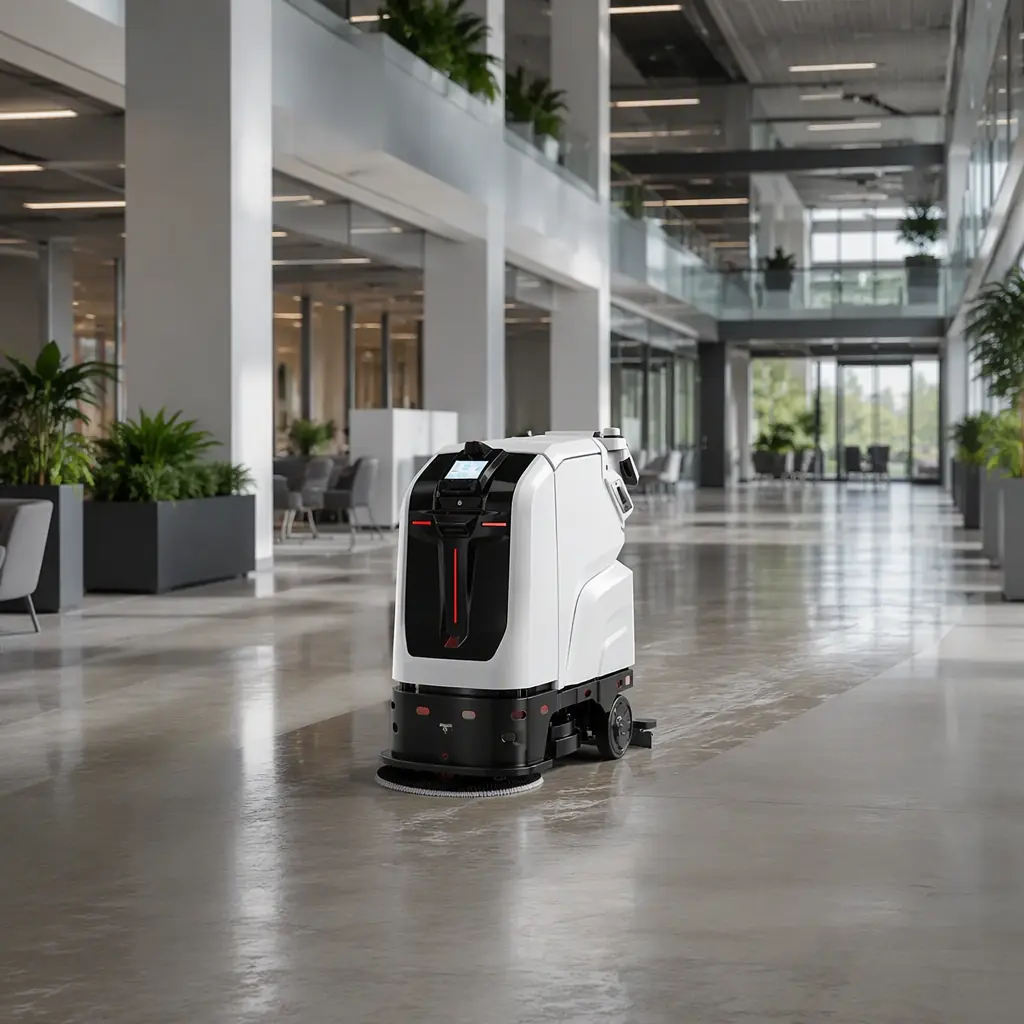
A 22,000 m² commercial facility in Shenzhen ran a cleaning cost audit with two options on the table: keep the 9-person night crew, or put two CLEINBOT M79 scrubbers and one CLEINBOT C2 Pro on the floor. The crew cost $18,400 a month in fully loaded wages. The robot route cost $2,150 a month in leases, power and consumables — and cleaned a measurable 30% more area each night. That is the gap this guide exists to quantify, because the single biggest mistake facility managers make is comparing a robot's purchase price against a single monthly wage instead of against the full, loaded, annualized cost of the labor it replaces.
The comparison is never "robot vs one cleaner." It is "robot + power + maintenance + amortized capex" against "a crew that gets paid overtime, calls in sick, gets trained, quits, and needs to be retrained." When you put the real numbers on both sides, commercial cleaning robots win on a much wider set of facilities than most buyers assume. This guide shows you the actual arithmetic.
The Loaded Labor Cost Few Managers Actually Calculate
Most cost comparisons use the hourly wage. The figure that matters is the fully loaded cost — everything an employer pays to have one cleaner on the floor for one hour. For a commercial facility, the loaded labor cost is usually 1.35–1.55× the base wage in emerging markets, or 1.5–2.0× in the US and Europe, once you add employer taxes, benefits, paid leave, uniforms, PPE, supervision and training overhead.
| Cost component | What it actually includes |
|---|---|
| Base wage | Hourly or monthly pay shown on the contract |
| Employer taxes & insurance | Payroll tax, workers' comp, social contributions |
| Benefits & paid leave | Vacation, sick days, holidays — paid while not working |
| Supervision | Shift lead or supervisor cost spread across staff |
| Training & onboarding | Every new hire is at least one paid week of unproductive time |
| Turnover | Replacement costs: recruiting, HR, re-training, lost output |
| PPE & consumables | Uniforms, gloves, chemicals, mop pads, brooms |
The turnover line is the one people consistently forget. The cleaning industry runs 40–80% annual staff turnover in many markets, which means roughly every 18 months you are paying to replace a large share of your crew. Each replacement costs about 2–4 weeks of the old hire's wage in recruiting and training productivity loss.
The multiplier rule: take the base wage, multiply by 1.4 (Asia) or 1.7–2.0 (US/EU) to get the loaded hourly cost, then multiply by the actual paid hours (including the overtime and shift premiums that keep a night cleaning operation running).
The Cost of a Manual Crew: A Real Worked Example
Let's model a 20,000 m² office building that currently runs a night cleaning crew. The facility needs a single floor-care pass across the common areas. Here is a realistic loaded-labor breakdown:
| Item | Value |
|---|---|
| Crew size | 8 cleaners + 1 supervisor (night shift) |
| Loaded wage per cleaner | $14/hour (US rate, loaded) |
| Supervisor loaded | $26/hour |
| Daily cleaning hours | 6 hours (night window) |
| Effective days / year | 260 |
Below is the annual calculation from those inputs:
8 cleaners: 8 cleaners × $14/hour × 6 hours × 260 days = $112/hour for the crew × 6 hours = $672/night × 260 days = $174,720/year for the crew alone. The supervisor adds $26 × 6 × 260 = $40,560. Total annual labor = $215,280. Add 10% for turnover, training and PPE overhead ≈ $236,800.
The key figure: this facility is spending roughly $236,000 per year on manual floor cleaning labor — before it spends a single dollar on robots. That is the benchmark to compare against, not one cleaner's monthly wage.
What an Autonomous Scrubber Actually Costs to Run
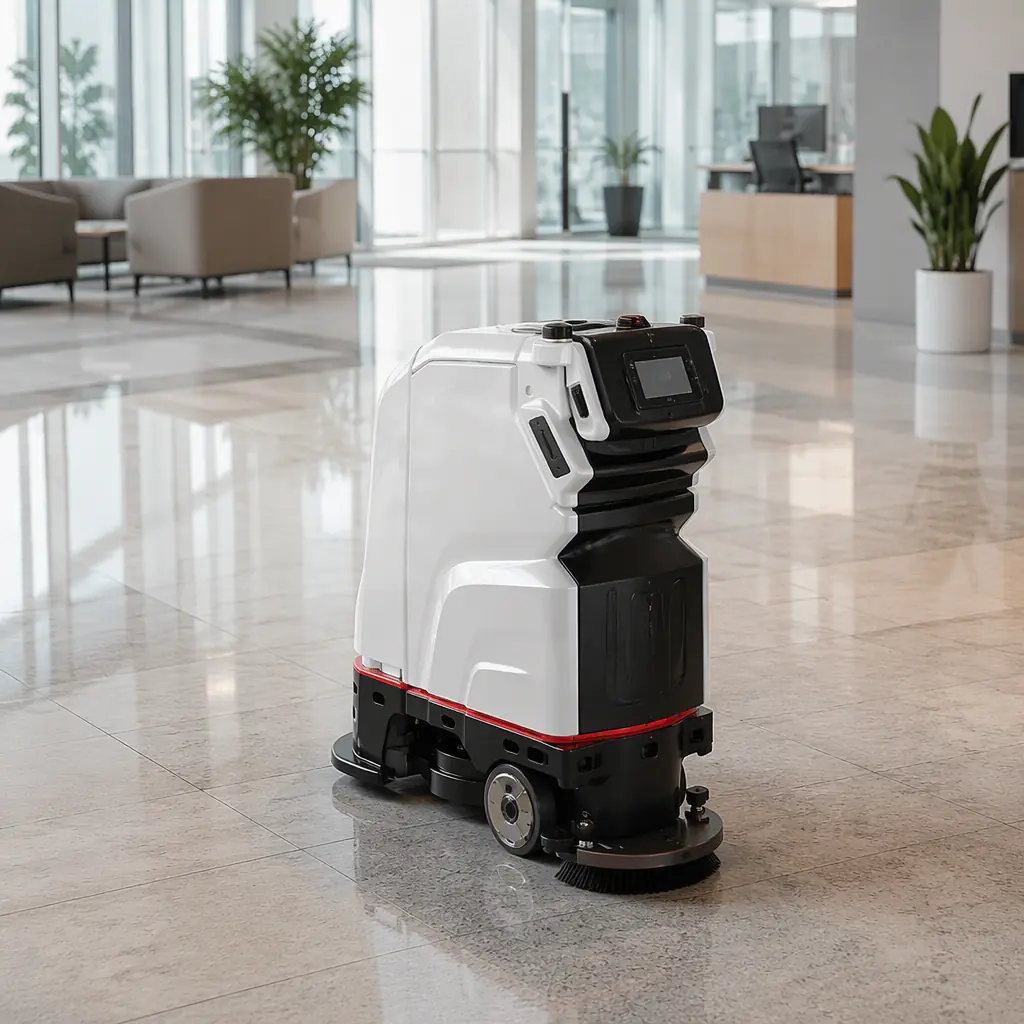
Now put a cleaning robot on the other side. The CLEINBOT M79 is a 95 kg indoor scrubber-dryer doing 2,000 m²/h with a 720 mm deck. The CLEINBOT C2 Pro is a 42 kg compact machine doing 500–800 m²/h on a 440 mm deck — the unit you use for corridors, break rooms and tight back-of-house. The real cost of these machines has four parts: capital (amortized) or lease, power, maintenance, and consumables/chemicals.
| Cost line | Monthly | Annual | Note |
|---|---|---|---|
| Robot lease or amortized capex | $900 | $10,800 | 3-year lease on a mid-size scrubber |
| Power | $60 | $720 | Robotic scrubbers are far more efficient than a human using a floor machine |
| Preventive maintenance & service | $150 | $1,800 | Scheduled service plan |
| Consumables (chemicals, pads, brushes) | $85 | $1,020 | Scrubber dosing is precise; far less waste than manual |
| Total per machine | $1,195 | $14,340 |
Two M79 machines plus one C2 Pro replace the 8-cleaner night crew — the robots run the corridors, lobbies and open office areas, while the C2 Pro handles the tight rooms. Combined robot cost: 3 × $14,340 = $43,020/year, or roughly $3,585/month.
Annual robot cost ≈ $43,000 vs annual manual labor cost ≈ $236,800. That is a ~5.5× cost difference in the robot's favor, and it does not yet count the extra coverage or the predictable, auditable quality.
The 5 Cost Traps That Skew This Comparison
If the robot looks too good, it is usually because one of these five traps has crept into your spreadsheet. Identify them and fix the math before you commit.
Trap 1: Comparing purchase price to one month's wage. This is the most common error. A $28,000 robot looks expensive against a $2,800 monthly wage, but it replaces roughly $18,000+/month of loaded labor. Compare annualized totals, never a sticker price against a paystub.
Trap 2: Ignoring labor that never goes away. Real deployments rarely eliminate 100% of the crew. Robots do the bulk repetitive floor pass; you still need a small crew for edge cases and detail work. Model the robot alongside a reduced (not zeroed) crew.
Trap 3: Forgetting uptime and coverage math. A human cleaner is productive maybe 75% of a shift after breaks and travel; a robot with a smart charge cycle can run much higher utilization, but it does need docking and occasional intervention. The fleet sizing guide shows how to compute the real m²/h delivered, not the theoretical rating.
Trap 4: Understating maintenance and consumables. A robot with a water-exchange and detergent dosing system uses chemicals far more precisely than manual mopping — but pads and brushes are a recurring line. Budget them.
Trap 5: Counting labor and robots as mutually exclusive. The highest-ROI model is often hybrids: robots handle the 70% repetitive pass, staff handle the 30% detail. Model the blended cost, not an all-or-nothing switch.
ROI & Break-Even: The Sheet You Need to Run
To compute your own break-even, use the ROI framework but plug in your real figures:
Break-even months = (Robots' annualized cost ÷ (Annual manual labor cost − Annual robot cost)) × 12, measured against the manual-labor baseline. In the worked example above:
- Annual manual labor: $236,800
- Annual robot cost: $43,020
- Annual saving: $193,780 (about 82% of the labor bill)
- If the initial capex is $75,000 for three machines: break-even ≈ 4.6 months (75,000 ÷ 193,780 × 12).
That is an unusually short payback because the labor being replaced was unusually expensive. In a lower-wage market, the break-even stretches to 18–30 months — still a healthy return, but the decision is less automatic. That is why you must run this math per facility, not copy a template.
Detailed budgeting by facility size is in the service robot budget planning guide, and the full ownership picture — maintenance, downtime, replacement parts — is in the maintenance & TCO guide.
Quality and Consistency: The Value Robots Add Beyond Savings
The cost comparison alone understates the case. A robot delivers a consistent, measurable result every pass. Modern scrubbers leave hard floors roughly 90% dry within 90 seconds, so you get a usable floor immediately after cleaning — which matters in a facility that opens right after the night shift. Robotic dosing uses a fixed, calibrated amount of detergent, so you do not find floors slick from too much solution or streaked from too little.
Predictability is also a compliance asset. Audit logs from the robot's run history show exactly when each zone was cleaned, which is valuable for facilities under health, sanitation or insurance requirements. The occupancy-triggered cleaning model takes this further, letting a robot clean a zone only when it is actually empty.
Choosing the Right Machine for the Labor-Efficiency Math
The CLEINBOT cleaning line spans three machines, and the right one for your cost case depends on the surface and the layout:
- CLEINBOT M79 — the workhorse: 2,000 m²/h, 720 mm deck, best on large open areas like lobbies, concourses, and open-plan offices.
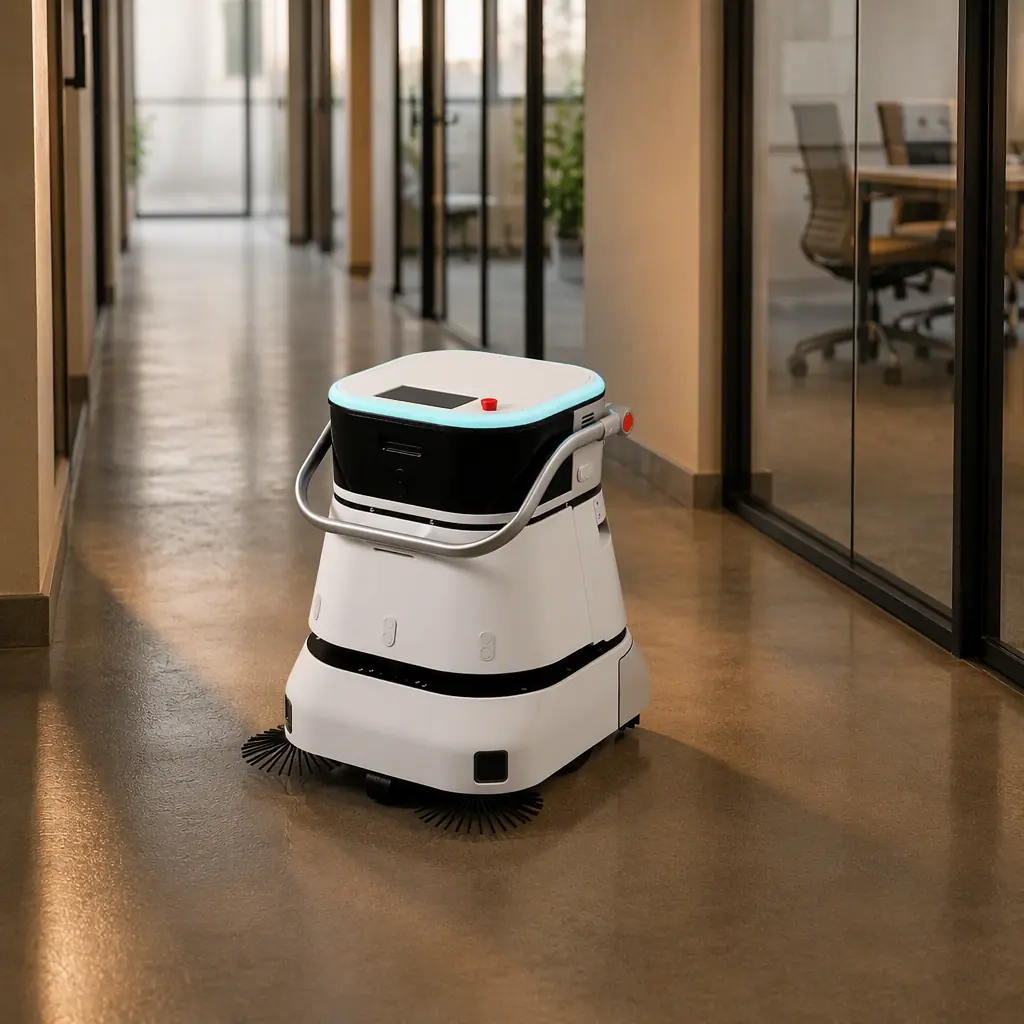
- CLEINBOT C2 Pro — the compact unit: 500–800 m²/h, 440 mm deck, built for narrow corridors, meeting rooms and back-of-house where a larger machine cannot turn.
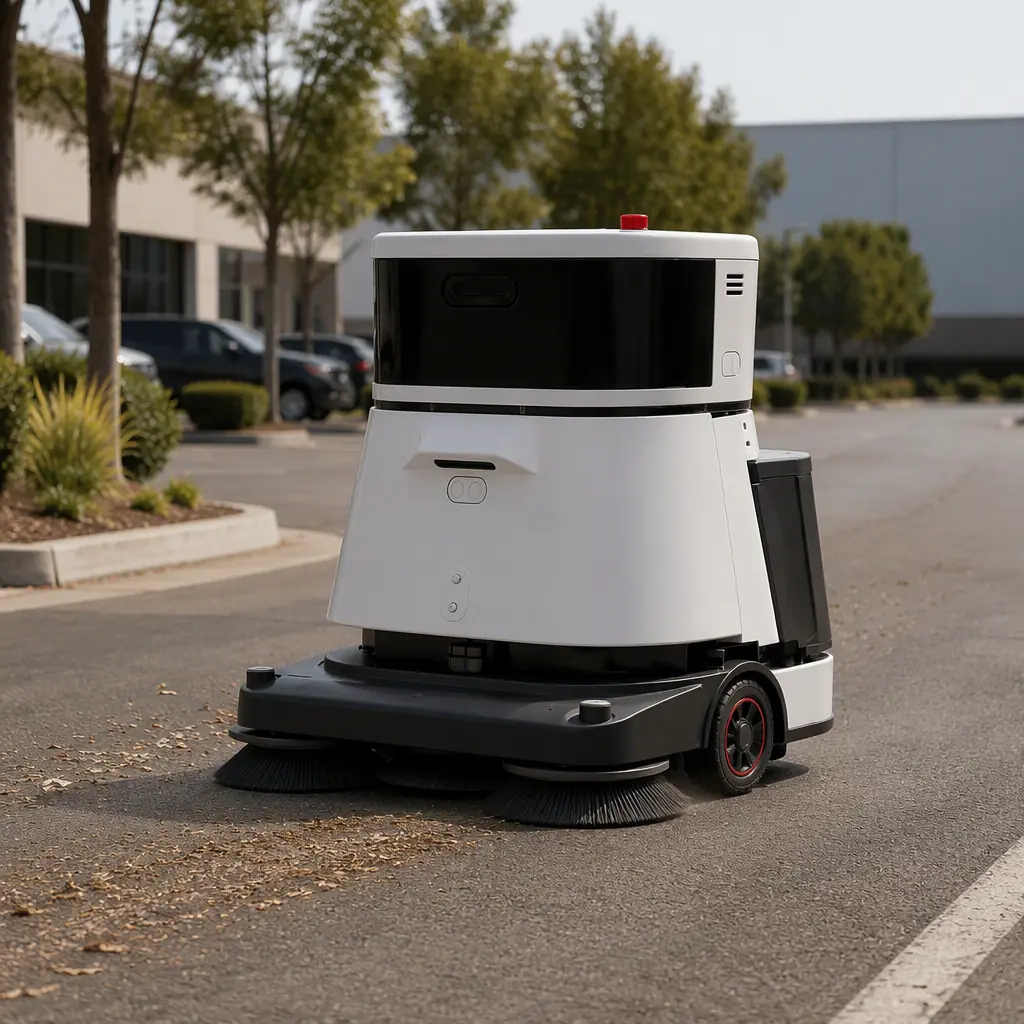
- CLEINBOT CC201 — the outdoor sweeper: 3,000 m²/h, 1,020 mm sweeping deck, IP67 sealing for parking lots, industrial yards and entrances.
Pick the combination that maximizes coverage against your real labor bill. The CLEINBOT comparison guide walks through machine-by-machine decision points.
The Bottom Line
Manual cleaning labor is one of the most under-audited line items a facility carries, and it is very often 4–6× more expensive than the autonomous alternative once every loaded cost is counted. The decision is not close in higher-wage markets and still favorable in most others — provided you compare annualized totals, include the retained detail crew, and budget maintenance and consumables honestly.
Run the break-even sheet above with your own wage and schedule before you sign anything. The math, not the marketing, is what tells you whether commercial floor-cleaning robots are the right call for your facility — and almost always the honest answer is yes.