"How many robots do I need?" is the first question every facility manager asks — and the one most vendors answer with a finger in the air. The honest answer is that fleet size is arithmetic, not intuition. Size one robot per function, multiply by the coverage window, and add a redundancy buffer. This guide gives you that arithmetic.
Underbuying is obvious: floors stay dirty, deliveries slip, staff burn out. Overbuying is the quieter killer — robots idle at their docks, the capital sits unused, and the ROI case that justified the purchase never closes. Getting the number right matters more than getting the model right.
There are three distinct robot functions, and each has its own sizing method. Clean one floor with one number, deliver with another, and greet with another.
Step 1: Clean — Coverage-Rate Math
Cleaning robots are sized by coverage rate. Each CLEINBOT model has a rated m²/h, and you divide your cleanable area by that rate, then by your actual cleaning window (not 24 h — your real operating window).
The formula:
Robots = (Cleanable area ÷ m²/h) ÷ Cleanable hours per night
The CLEINBOT M79 does 2,000 m²/h. A hospital with 14,000 m² of hard floor and a 6-hour nightly window:
14,000 ÷ 2,000 = 7 hours → 7 ÷ 6 = 1.17 → round up to 2 robots
That 0.17 overage matters. One M79 cannot finish a 14,000 m² pass in a 6-hour window, and stretching to 7 hours eats into shift handover. Two robots give you a full clean with a 3-hour buffer for the unexpected — a spill, a cordoned-off area, a recharge.
For tighter, compartmentalised layouts the CLEINBOT C2 Pro (500–800 m²/h) is the access machine, but the arithmetic is identical: divide your mapped effective area by its rate. Because it gets wedged less in narrow spaces, some facilities find it finishes a confined area in fewer "hours" than raw m²/h predicts.
For outdoor surfaces — plazas, car parks, industrial access roads — the CLEINBOT CC201 does 3,000 m²/h with a 130 L auto-emptying bin.
The ratio that prevents overbuying: if the fractional result is below 0.5, you almost certainly need one robot, not two. Anything above 1.2 needs two — unless you add a second overnight shift. Facilities that split into two shifts can often halve their fleet.
Step 2: Deliver — Trip Math
Delivery robots are not sized by area; they are sized by trip throughput. Two variables: payload per trip, and trips per hour.
The formula:
Robots = (Daily delivery demand in kg) ÷ (Payload × Trips/hour × Working hours)
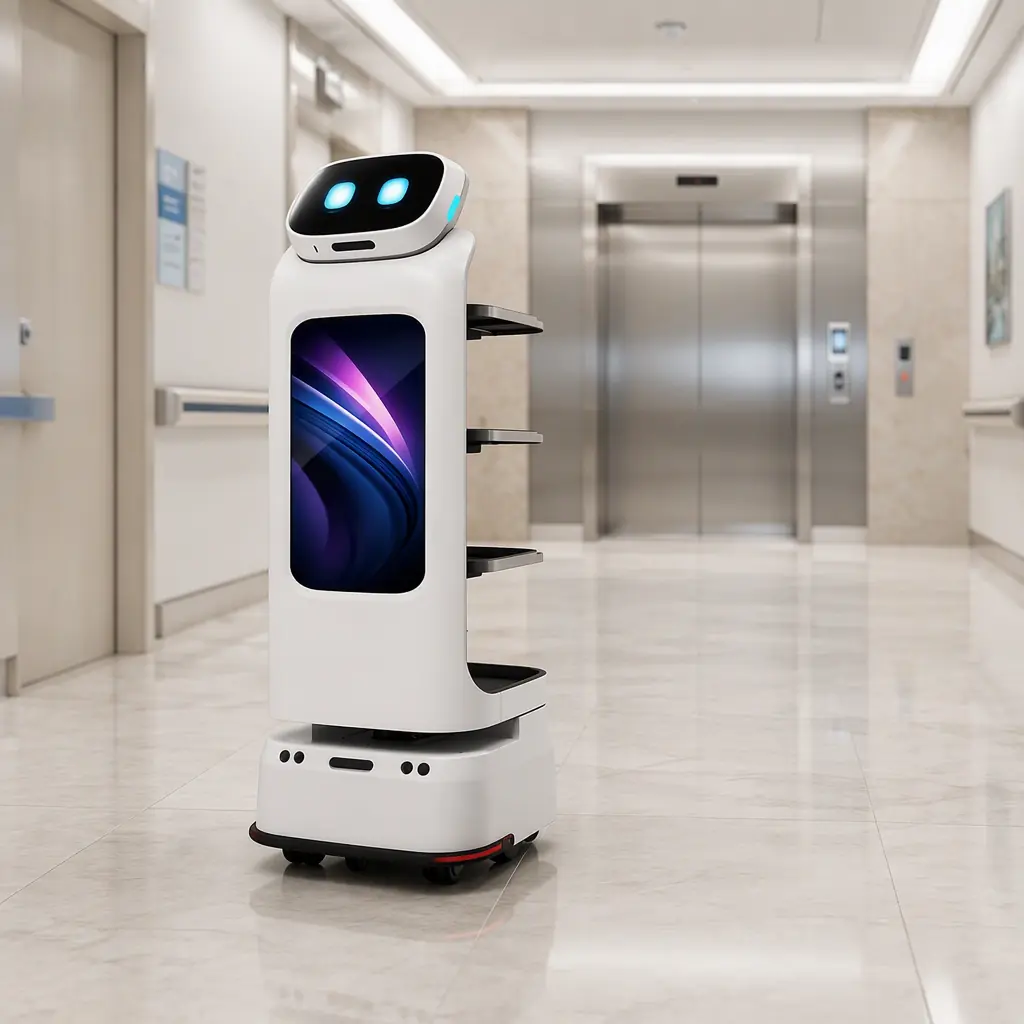
The CADEBOT L100 carries 60 kg across 4 tray layers (15 kg each) and moves at 0.3–1.2 m/s. In an office or hospital with central dispatch, a realistic throughput is 8–12 loaded trips per hour depending on route length, elevator waits, and door dwell time. The AOMAN DOUBLE carries a 70 L dual cabin — the split cabin is the point, because it lets one robot drop a delivery and collect a return in the same route, cutting empty-return mileage to near zero.
A hospital moving 1,500 kg of meals, linen, and supplies per day:
1,500 ÷ (60 kg × 10 trips × 8 h) = 1,500 ÷ 4,800 = 0.31 → 1 robot
That 0.31 says one robot handles it — but with almost no headroom. Add a peak-hour surge (meal times triple demand) and the honest answer is two, or one robot plus manual help during the two meal rushes. Elevator integration is the multiplier that decides this; see our delivery robot elevator integration guide.
For the design choice between single and dual cabin, the delivery robot selection guide covers it in depth.
Step 3: Serve — Query Math
Reception and concierge robots are sized by interaction throughput. The CRUZR humanoid handles wayfinding, greeting, and FAQs with 50+ languages. Airport deployments run 2 CRUZR units at ~600 interactions each per day — roughly 1,200 interactions served.
The rule of thumb: one CRUZR sustains about 500–700 interactions per day at a reception-style duty before queue wait times degrade. Above that, add a unit. For the passenger-facing detail, read our reception and concierge robots guide and the humanoid robots in retail piece.
Step 4: Add the Redundancy Buffer
Every fleet needs a spare. Two hard rules:
- One robot per function minimum. A single cleaning robot covering your whole floor leaves zero resilience. If a robot goes down for a dock fault, who cleans tonight? The service robot failure modes article lists the realistic failure scenarios.
- Budget 10–15% spare. Manufacturers recommend one extra unit per 8–10 deployed to cover maintenance downtime and battery-duty cycling. This is the difference between a pilot and a production deployment.
Charging infrastructure scales the other direction — robots cannot all dock at one pile. Place charging docks within 50 m of the primary route, one per 4 robots for cleaning fleets, and use multi-location standby for delivery robots so they recharge where the next job starts. For the full orchestration picture, our fleet management guide walks through task dispatch, predictive charging, and cross-type path coordination.
The Sizing Worksheet
Copy this into your planning doc. Three rows, one per function, then sum with a redundancy buffer.
| Function | Input | Result | Robots (round up) |
|---|---|---|---|
| Cleaning | Area ÷ m²/h ÷ window | ___ | ___ |
| Delivery | Demand kg ÷ (payload × trips × h) | ___ | ___ |
| Reception | Interactions ÷ 600 | ___ | ___ |
| Redundancy | 10–15% buffer on total | ___ | ___ |
Total fleet for a facility with all three functions is usually 2 cleaning + 1–2 delivery + 1 reception, or roughly 4–5 robots for a 20,000 m² mixed site. That is not a guess — it is the sum of three independent calculations, each defensible to a CFO.
The Three Ratios That Catch Mis-Sizing
Before you sign, sanity-check against these three ratios:
- Utilisation ≥ 60%. If a robot works less than ~60% of its available shift, you overbought.
- One robot per 15,000 m² indoor / 20,000 m² outdoor as a rough ceiling — above that, add a unit.
- Redundancy ≥ 1 spare per function. If you cannot lose one robot and still operate, you underbought.
Match this to a funded plan rather than a wishlist. The ROI guide and budget planning turn your robot count into a capital and operating line, and the RaaS financing models show how to get there without a heavy capex line.
Final Word
Fleet sizing is three multiplication problems and a buffer. Run the coverage math for cleaning, the trip math for delivery, and the query math for reception — then add 10–15% spare. Validate with the three ratios. If the number feels wrong, trust the arithmetic, not the gut. A correctly sized fleet of four robots earns more than an oversized one of eight that sits at its dock.
Deploy in phases to de-risk: start with a 30-60-90 day pilot on your highest-volume function, collect 30 days of actual utilisation data, then scale to the full calculated fleet. Let the data set the final count.