A colocation data center operator running 120,000 square feet of raised floor across three facilities in Northern Virginia faces a monitoring coverage gap that every operator recognizes but few quantify: the 6-inch space between rack rows where fixed sensors don't reach, the 3 AM security patrol that skipped the B-row mezzanine because the guard was tired, and the 47 assets that moved between racks during a maintenance window in March but weren't logged in the DCIM system until the quarterly audit in June. These gaps individually seem minor — a thermal hotspot that self-resolves, a single missed patrol, a server that's in row C instead of row D but still online. Collectively, they represent the difference between a data center that operates with 99.9% uptime and one that hits 99.999% — a difference worth approximately $2.4 million per year in SLA credits and customer churn for a 10 MW facility.
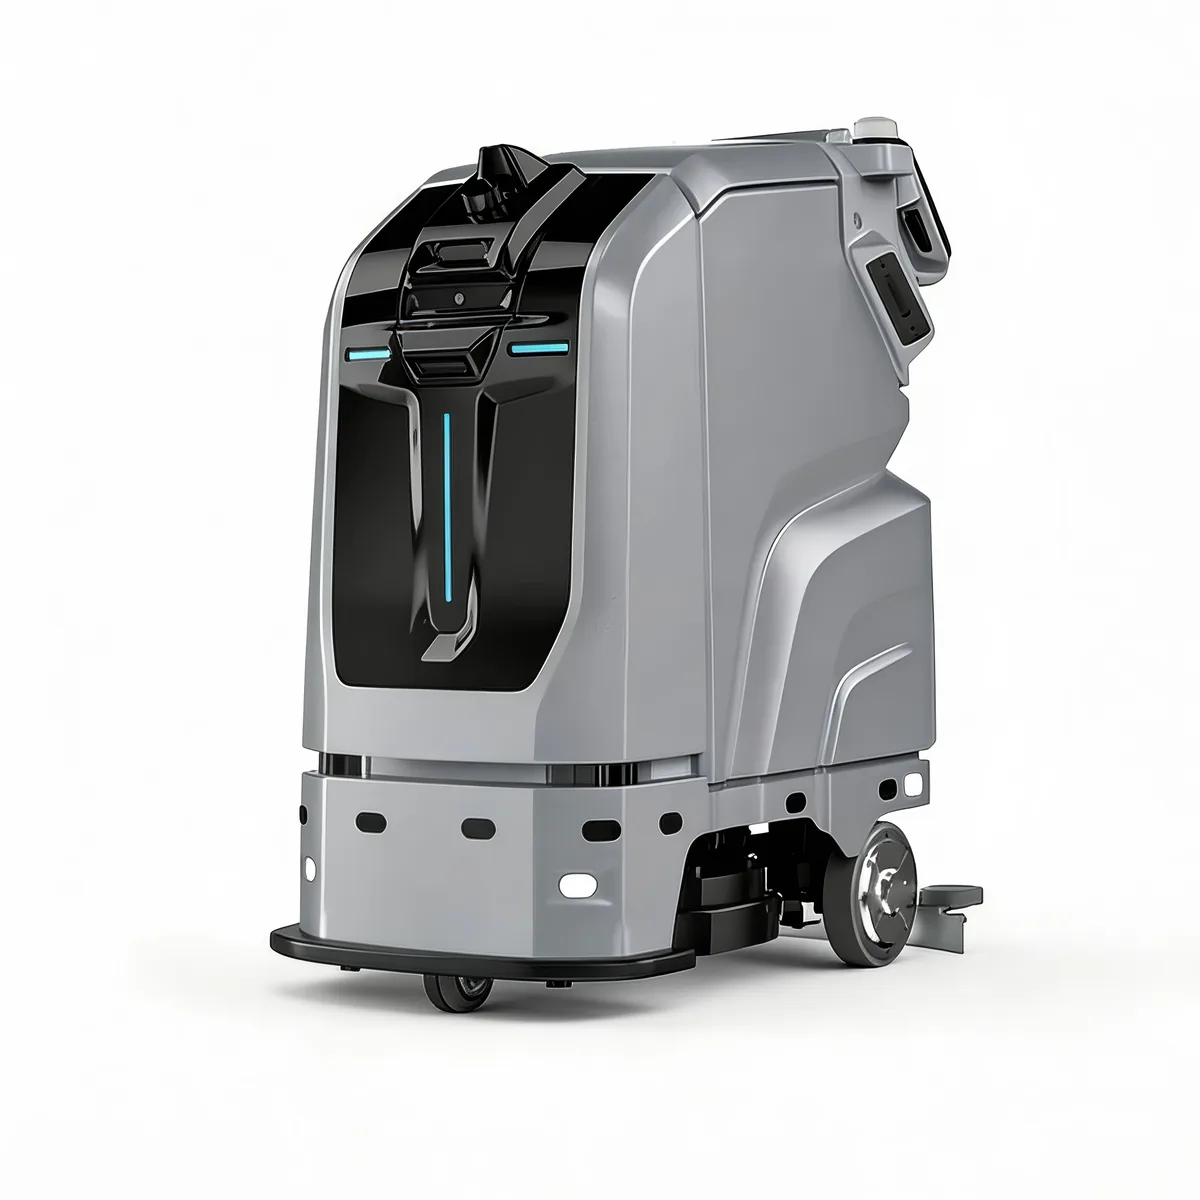
In January 2026, the operator deployed four autonomous monitoring robots — two per facility, running overlapping patrol routes on an 18-minute cycle during peak thermal load hours (2 PM–8 PM) and a 45-minute cycle overnight. Each unit carries a FLIR thermal camera array, a particle counter for airborne contaminant detection, an RFID reader for automated asset verification, humidity and acoustic sensors, and a 360° optical camera with low-light capability. The robots do not replace the DCIM system — they feed it. Every patrol cycle generates approximately 1,200 data points per rack row — temperature gradients across server faces, humidity at the cold-aisle midpoint, asset tag reads, acoustic signatures that correlate with fan-bearing degradation — and pushes them into the existing BMS dashboard via a REST API integration that took the operator's engineering team four days to implement.
At month 6, the operator's data showed three outcomes: (1) thermal anomaly detection improved from 14-minute mean-time-to-detect (MTTD) under fixed-sensor-only coverage to 4.1 minutes under robot-augmented coverage — a 71% improvement; (2) asset inventory accuracy rose from 93.2% (quarterly manual audit baseline) to 99.7% (continuous RFID verification); and (3) the security team reduced overnight patrol staffing from three guards to one, with the two redeployed guards moved to SOC analyst training — a $187,000 annual labor reallocation that funded the robot lease costs within 14 months.
Why Fixed Sensors Alone Cannot Achieve Tier III+ Monitoring Density
The standard approach to data center environmental monitoring is to install temperature and humidity sensors at the rack-row endpoints — typically one sensor per three to five racks. This creates a monitoring grid with approximately 6-10 feet of granularity. For a 42U rack dissipating 8-15 kW, the thermal gradient from the bottom server (intake at 22°C) to the top server (intake potentially at 32°C if airflow management is imperfect) creates a 10°C delta that a single row-end sensor cannot capture. The row-end sensor reads the ambient air at its mounting point, which may be 24°C while the top-of-rack server is ingesting 32°C air — within ASHRAE TC 9.9 allowable range but 8°C above optimal, accelerating component degradation at a rate that compounds across the 3-5 year server lifecycle.
A mobile monitoring robot traversing the cold aisle at rack-face distance (12-18 inches from the server fronts) captures thermal data at 1-2 inch vertical increments across the full 42U face. A single patrol pass generates a thermal profile that identifies not just "is rack B14 too hot" but "servers at U38-U42 in rack B14 are ingesting air at 31°C while servers at U2-U6 are at 24°C — the containment airflow baffles above U36 are not directing hot exhaust properly." This level of diagnostic specificity enables the facilities team to dispatch a targeted fix (adjust one baffle) rather than a generic response (increase CRAC output across the entire row, consuming 4-7 kW of additional cooling energy).
The economics of achieving equivalent coverage with fixed sensors illustrates why mobile monitoring is not just operationally superior but capital-efficient:
| Monitoring Approach | Sensors Required (per 100-rack row) | Installation Cost | Annual Calibration Cost | Coverage Granularity |
|---|---|---|---|---|
| Fixed row-end sensors (standard) | 20-33 | $18,000-30,000 | $4,500-7,500 | 6-10 ft |
| Fixed per-rack sensors (dense) | 100 | $90,000-150,000 | $22,500-37,500 | Per rack |
| Fixed per-1U sensors (maximum) | 4,200 | $3.8-6.3M | $950K-1.6M | Per server |
| Autonomous patrol robot (1 unit) | 0 fixed sensors | $0 installation | Robot maintenance only | Per 1-2 inches |
The robot's capital efficiency becomes decisive at scale. A 50 MW campus with 20 data halls would require either $3M in additional fixed sensor infrastructure (dense approach) or 15-20 patrol robots at approximately $18,000-24,000 per unit annually on lease — a 6-8× cost advantage that increases with facility size.
This monitoring paradigm aligns with the operational philosophy documented in the manufacturing automation guide, where mobile sensing platforms similarly outperform fixed sensor grids in environments with high asset density and dynamic thermal loads.
Asset Tracking: From Quarterly Manual Audits to Continuous RFID Verification
Every data center operator has experienced the audit discrepancy: the DCIM says server SRV-DC1-B14-U22 is an HPE ProLiant DL380 Gen10 with serial number CZ2938XYZ, but the physical unit in that slot is a Dell PowerEdge R750 with a different serial number. The swap happened during an emergency maintenance window at 2 AM, the technician updated the ticket but forgot to update the DCIM, and the discrepancy goes undetected until the next quarterly audit — by which time six more servers have been swapped, decommissioned, or repositioned, and reconstructing an accurate inventory requires two engineers and 40 hours of manual reconciliation.
An autonomous patrol robot with an integrated UHF RFID reader eliminates this drift. As the robot traverses each row, its RFID antenna reads the asset tag on every server, switch, storage array, and PDU within 3-6 feet. Each tag read is timestamped, geolocated to rack-and-U position using the robot's SLAM navigation data (see robot navigation and SLAM guide for technical details on how positional accuracy achieves sub-inch precision in structured indoor environments), and compared against the DCIM database. A mismatch generates an automated ticket in the operator's service management platform within 90 seconds of detection.
The compliance value extends beyond operational efficiency. For data centers subject to SOC 2 Type II audits, the robot-generated asset tracking logs provide continuous evidence of physical asset control — a control objective that manual quarterly audits satisfy only at the audit date, leaving the intervening 89 days undocumented. For HIPAA-covered entities hosting protected health information (PHI), the ability to demonstrate continuous, automated verification of which physical servers store PHI-affected data — rather than relying on a spreadsheet updated quarterly — materially strengthens the compliance posture during an OCR investigation.
This approach to auditable automation overlaps significantly with the documentation and validation requirements covered in the pharmaceutical GMP manufacturing guide and the laboratory automation guide, where regulatory audit trails demand the same level of continuous, timestamped, sensor-based evidence.
Security Patrol: Closing the Gap Between SOC Alerts and Physical Response
The standard data center security model combines perimeter controls (fencing, badge-access mantraps, CCTV) with roving guard patrols (typically one patrol per 2-3 hour shift, covering all rows). The vulnerability is the gap between a SOC-generated alert and physical verification. When the access control system logs a badge swipe at a cage door at 3:17 AM and the SOC operator cannot visually confirm the individual on CCTV — the camera covering that angle has a dead zone in the corner of its field of view — the response protocol requires dispatching a guard to physically walk to the cage. The guard's average response time in the Northern Virginia facility: 11 minutes from alert to arrival, because the guard was on the opposite side of the 120,000-square-foot floor conducting a different patrol task.
An autonomous security patrol robot changes this equation. When the SOC receives an unverifiable access event, the operator can reroute the nearest patrol robot to the affected cage immediately — not in 11 minutes, but in 90-180 seconds, because the robot is always within 2-4 rows of any location on its continuous patrol pattern. The robot arrives, streams 360° video to the SOC operator's console, and the operator can confirm or escalate within 30 seconds of video arrival. Total time from alert to visual confirmation: under 4 minutes, compared to 11+ minutes under the guard-only model.
The security dimension also connects to the operational resilience themes in the multi-site deployment strategy guide — particularly the "lights-out" operating model where facilities with minimal overnight staffing rely on autonomous patrol platforms as the first line of physical security response.

Integration Architecture: Making the Robot Talk to Your DCIM
The most common deployment failure mode is not the robot hardware — it's the integration disconnect. A robot that collects superb thermal and asset data but cannot push it into the existing BMS/DCIM dashboard creates a second monitoring interface that the operations team will ignore within three weeks. The integration must be bidirectional: the robot feeds data into the existing dashboard, and the existing dashboard can command the robot (reroute to investigate an alert, pause patrol for maintenance access, adjust patrol frequency during thermal events).
The reference integration architecture that produced the strongest adoption outcomes uses a three-layer model:
Layer 1: Data ingestion. The robot streams patrol data (thermal, humidity, RFID, acoustic, optical) to a local edge processor via WiFi 6 or private 5G, depending on the facility's wireless infrastructure. The edge processor — typically a 1U server in the same data hall — runs a lightweight MQTT broker that normalizes the robot's data format to the schema expected by the BMS/DCIM system.
Layer 2: Dashboard integration. The normalized data appears in the existing BMS dashboard as additional sensor feeds — the operations team sees "Robot 2 — Cold Aisle B — Thermal Profile" alongside their existing "CRAC-14 Return Air Temp" and "PDU-B3 Phase A Current" readings. No new dashboard. No new login. The robot-generated data is presented in the same visualization framework the team already uses.
Layer 3: Command and control. The fleet management platform — covered in detail in the fleet management guide — provides the operations director with patrol scheduling, robot health monitoring, and integration status for every unit across every facility. The platform also exposes a REST API that the BMS/DSC (Data Center Security) system can call to reroute robots in response to alerts. A SOC operator clicking "Investigate — Cage C7" in the security dashboard triggers an API call that reroutes the nearest patrol robot to cage C7, with video feed appearing in the SOC console within 120 seconds.
For organizations evaluating the total cost of ownership across hardware, integration labor, and ongoing maintenance, the maintenance and TCO guide provides a structured cost model that separates one-time integration costs from recurring operational costs.
The Metric That Convinces Colocation Customers to Pay a Premium
The most commercially significant outcome of robot-augmented monitoring is not operational — it's competitive. Colocation providers that can demonstrate continuous, robot-verified environmental monitoring and asset tracking to prospective customers convert at a higher rate and command a price premium.
The Northern Virginia operator tested this hypothesis by creating a "Verified Monitoring" add-on tier for new colocation contracts: $45 per rack per month for robot-verified environmental monitoring with customer-facing dashboard access to thermal profiles, humidity trends, and asset verification logs for their specific racks. The tier launched in April 2026. Within the first quarter, 34% of new contracts included the add-on — an adoption rate that, applied to the operator's 1,800-rack footprint, represents $330,000 in incremental annual recurring revenue against a robot fleet cost of approximately $96,000 per year.
The premium is sustained by a simple asymmetry: competitors can match price, but they cannot match continuous monitoring coverage without deploying their own robot fleet — a 6-9 month procurement and integration cycle that gives the first mover a durable competitive window.