A 20-therapist sports medicine and orthopedic rehabilitation center in Phoenix, Arizona treats 320-380 patients per week across 12 private treatment bays, a 3,000 sq ft open gym floor, two aquatic therapy pools, and a modalities suite (ultrasound, electrical stimulation, laser therapy). The facility's operational bottleneck isn't therapist capacity — it's the 14% of every therapist's shift consumed by non-clinical tasks: wiping down treatment tables between patients, restocking linen carts, transporting hot packs and ice packs from the supply room to treatment bays, and walking lab orders to the front desk.
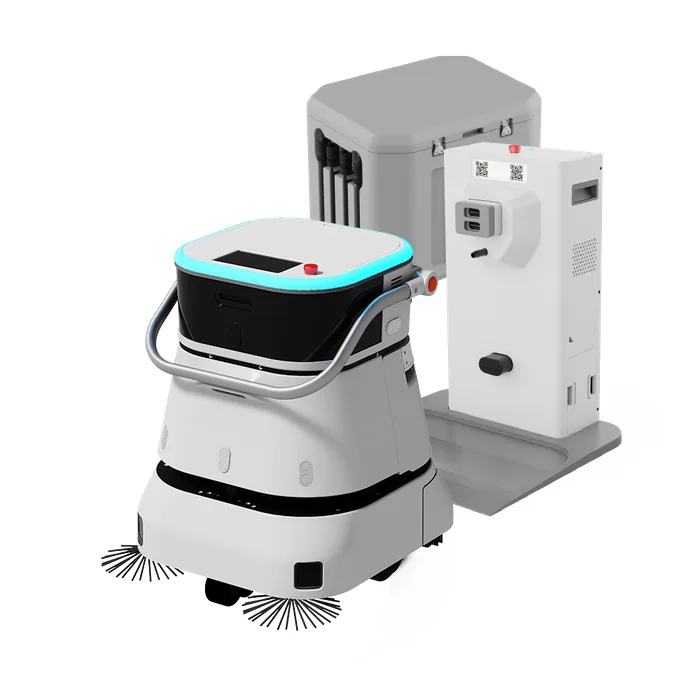
In February 2026, the center deployed two CLEINBOT C2 Pro autonomous floor scrubbers, one CADEBOT L100 for supply logistics, and integrated the fleet with the clinic's electronic medical record (EMR) system for appointment-driven cleaning schedules. After four months: therapist time recovered averaged 52 minutes per therapist per day, patient satisfaction scores (Press Ganey outpatient rehab benchmark) rose from 87.2 to 93.4, and surface cleanliness ATP scores dropped from 312 RLU to 91 RLU — exceeding the healthcare environmental hygiene benchmark of 250 RLU by 2.7×.

The Rehabilitation Facility's Hidden Labor Drain
Rehabilitation facilities face an operational paradox: the work that therapists are trained and licensed to do — manual therapy, therapeutic exercise prescription, gait training, neuromuscular re-education — generates revenue, while the work that consumes an increasing share of their day does not. A 2025 time-motion study published in the Journal of Orthopaedic & Sports Physical Therapy tracked 140 physical therapists across 28 outpatient clinics and found the following non-clinical time allocation per 8-hour shift:
| Task | Minutes/Shift | % of Shift | Annualized Cost (at $85/hr) |
|---|---|---|---|
| Treatment table cleaning/setup between patients | 42 min | 8.8% | $29,000 |
| Linen & supply restocking | 18 min | 3.8% | $12,500 |
| Equipment transport (modalities, hot/cold packs) | 14 min | 2.9% | $9,800 |
| Walking lab orders, prescriptions, paperwork | 22 min | 4.6% | $15,100 |
| Gym floor & equipment wipe-down | 16 min | 3.3% | $10,900 |
| Total non-clinical time | 112 min | 23.3% | $77,300 |
Across 20 therapists, this represents 37.3 therapist-hours per day — equivalent to 4.7 FTEs — performing tasks that require zero clinical judgment. The Phoenix center's robot deployment targeted the top three categories: table/gym cleaning (CLEINBOT C2 Pro), supply logistics (CADEBOT L100), and paperwork transport (CADEBOT L100 routes to front desk scanning station).
For organizations evaluating the broader framework for deciding which tasks to automate and which to keep human, the human-robot collaboration change management guide provides a task-allocation framework validated across healthcare, hospitality, and industrial deployments.
Three Robot Applications for Outpatient Rehab
Appointment-Driven Treatment Bay Turnover
The highest-frequency non-clinical task in any rehab clinic is treatment bay turnover: the 3-5 minute window between Patient A leaving and Patient B arriving when the table must be wiped down, pillowcases changed, linens replaced, and the floor area spot-cleaned. In a clinic seeing 14-16 patients per therapist per day, this happens 280-320 times daily.
The CLEINBOT C2 Pro integrates with the clinic's EMR scheduling system via API to receive real-time appointment data. When Patient A's appointment is marked "complete," the robot automatically routes to Treatment Bay 4 and executes the cleaning protocol — floor scrubbing, table-adjacent disinfection (the robot's side-mounted UV-C array treats the treatment table surface from 50 cm distance), and a verification pass that logs ATP readings for the bay's floor and table surface. Total cycle time: 2 minutes 40 seconds. When Patient B arrives at Treatment Bay 4, the floor is dry, the surface ATP log shows <100 RLU, and the therapist can begin treatment immediately.
The alternative — the therapist spending 3-5 minutes cleaning between patients — compounds across the day. At 14 patients × 4 minutes per turnover = 56 minutes of cleaning per therapist per day. Multiply by 20 therapists and the clinic loses 18.7 hours of billable treatment capacity daily to wiping tables and mopping floors.
For healthcare environments with similar infection control requirements but different facility layouts, the healthcare service robots guide covers inpatient applications, while the senior living facilities guide addresses the overlapping long-term care and rehabilitation use cases common in skilled nursing settings.
Gym Floor & Equipment Zone Maintenance
The open gym floor is the highest-traffic zone in any rehab clinic and the hardest to clean during operating hours. Patients performing therapeutic exercises on floor mats, therapists demonstrating gait patterns on the treadmill array, and athletes doing plyometric drills on the turf strip all shed skin cells, sweat, and therapeutic gel residues onto surfaces that the next patient will contact within minutes.
The CLEINBOT C2 Pro, operating at 1,200 sq m per hour, follows a zoned cleaning pattern on the gym floor: Zone A (mat area, highest contamination) every 45 minutes, Zone B (treadmill/cardio array) every 60 minutes, Zone C (turf/track strip) every 90 minutes. The robot's obstacle avoidance system navigates around patients mid-exercise and therapists providing hands-on guidance — it slows to 0.3 m/s when approaching occupied zones and routes around any area where a patient is lying on the floor or performing supine exercises.
The critical metric for gym floor cleaning is intervention rate — the percentage of cleaning cycles where a human staff member must stop what they're doing to move an obstacle or override the robot's route. In the Phoenix center, the C2 Pro's intervention rate stabilized at 2.1% after the first two weeks of deployment (the learning period during which the robot maps the typical positions of exercise balls, resistance bands, foam rollers, and other floor-level equipment that changes position throughout the day). Any intervention rate below 5% is considered operationally sustainable — above that threshold, the robot creates more staff work than it eliminates.
For facilities managing larger rehabilitation footprints — hospital-based outpatient departments that may span multiple floors — the multi-site deployment strategy guide covers the fleet coordination and centralized monitoring architecture that enables consistent cleaning across distributed facilities.
Supply Logistics: Hot/Cold Packs, Linens, and Modality Equipment
Rehabilitation clinics consume supplies at a rate that surprises facility managers who haven't tracked it: a 20-therapist clinic uses approximately 180 hot packs, 140 cold packs, 220 pillowcases, 180 treatment table sheets, and 90 towel packs per day. All of these items must move from central supply storage to individual treatment bays, and used items must return to the laundry or rethermalization station.
The CADEBOT L100, operating on a continuous delivery loop, eliminates this supply logistics chain. The robot's 70L dual-cabin design carries clean linens and freshly heated/chilled packs in Cabin A — outbound to treatment bays — and collects used linens and depleted packs in Cabin B — inbound to the laundry and rethermalization station. The dual-cabin separation prevents cross-contamination without requiring a second robot or separate outbound/inbound runs.
The Phoenix center's logistics metrics after four months:
| Metric | Pre-Robot | Post-Robot | Change |
|---|---|---|---|
| Supply runs per day (staff) | 64 | 4 (restock only) | -94% |
| Bay-to-laundry transport time | 18 min/bay/day | 0 min | -100% |
| "Out of hot packs" incidents per week | 8.4 | 0.6 | -93% |
| Linen inventory variance (lost/misplaced) | 12%/month | 1.5%/month | -88% |
The robot runs on a 40-minute loop: load at central supply → deliver to Bays 1-6 → collect used items → deliver to Bays 7-12 → collect used items → return to supply/laundry. Each bay receives a supply drop every 40 minutes during operating hours, ensuring that no therapist ever leaves a patient mid-session to hunt for a hot pack or clean pillowcase.

The Patient Experience Dimension
Rehabilitation patients spend more time in the facility per visit than almost any other outpatient healthcare setting — typically 45-90 minutes per session, 2-3 times per week, for 6-12 weeks. This repeated, extended exposure means they notice facility conditions that a 15-minute primary care visit patient would never register.
The Phoenix center tracked patient satisfaction across three dimensions before and after the robot deployment:
| Satisfaction Dimension | Pre-Deployment (n=640) | Post-Deployment (n=580) | Change |
|---|---|---|---|
| "Facility cleanliness" (1-5) | 4.1 | 4.8 | +0.7 |
| "Wait time between modalities" | 3.6 | 4.5 | +0.9 |
| "Therapist attention/focus" | 4.3 | 4.7 | +0.4 |
The "wait time between modalities" improvement is the most instructive metric. In a typical rehab session, a patient moves through 3-5 treatment stations: initial assessment → manual therapy → therapeutic exercise → modality application (ice/heat/stimulation) → discharge instructions. The transitions between these stations previously involved the therapist cleaning the previous station, fetching supplies for the next, and walking paperwork — 3-7 minutes of patient wait time at each transition. With robots handling cleaning and logistics, therapist transition time dropped to under 60 seconds, and patients moved through their sessions with minimal idle time.
The "therapist attention/focus" improvement, while smaller in absolute terms, reflects a qualitative shift that therapists themselves report: when they're not mentally tracking whether they need to restock hot packs or whether the treatment table has been cleaned, they're more present with the patient in front of them. This effect is consistent with findings from healthcare service robot deployments where clinical staff report higher job satisfaction when non-clinical tasks are automated.
Financial Analysis: 20-Therapist Sports Medicine Center
| Category | Annual Pre-Robot | Annual Post-Robot | Change |
|---|---|---|---|
| Therapist non-clinical time (4.7 FTE equivalent) | $363,000 | $127,000 | -$236,000 |
| Dedicated cleaning staff (2 FTE) | $82,000 | $41,000 | -$41,000 |
| Linen loss/replacement | $14,400 | $2,600 | -$11,800 |
| Robot lease (2 × C2 Pro + 1 × CADEBOT) | $0 | $38,600 | +$38,600 |
| EMR integration & API setup (one-time) | $0 | $12,000 | +$12,000 |
| Maintenance & consumables | $0 | $7,800 | +$7,800 |
| Net annual impact | $459,400 | $229,000 | -$230,400 |
The 4.7 FTE of recovered therapist time translates to approximately 7,500 additional billable patient visits per year — assuming the center can fill the capacity, which in most markets is not a constraint given 4-6 week waitlists for orthopedic rehab. At an average reimbursement of $110 per visit, this represents $825,000 in additional annual revenue potential beyond the cost savings shown above.
Break-even on the robot investment occurs in month 2.5. For the full total cost of ownership and lease versus purchase analysis, see the service robot maintenance and TCO guide and RaaS financing models guide.
Implementation Roadmap
Phase 1 (Month 1-2): Single-location PT clinic (5-10 therapists). Deploy one CLEINBOT C2 Pro covering treatment bays and gym floor. Map the facility over a weekend — gym floors are straightforward, but treatment bays with sliding curtains require curtain-detection training (the robot must recognize curtains as pass-through barriers, not walls). Run on a timer-based cleaning schedule keyed to appointment slots: clean each treatment bay at the top of the hour when appointments typically transition. Expected outcome: 3-4 hours of therapist time recovered per day, improved patient flow.
Phase 2 (Month 3-6): Add supply logistics. Deploy one CADEBOT L100 on a continuous loop between supply storage, treatment bays, and laundry. The robot needs 40-inch minimum corridor width and door thresholds ≤2 cm — older clinic buildings may require minor threshold modifications ($200-400 per doorway). Expected outcome: 90%+ reduction in therapist supply runs, measurable linen inventory improvement.
Phase 3 (Month 7-12): Multi-site network rollout. For rehab chains with 5-50 locations, deploy standardized robot configurations across all sites with centralized fleet management. The network effect is significant: centralized firmware updates, consolidated maintenance contracts, and cross-site benchmarking enable each new location to deploy faster and reach operational stability sooner than the first site.
Critical pre-deployment considerations specific to rehab settings:
- Aquatic therapy areas: Standard floor robots cannot enter pool deck areas due to slip hazards and water infiltration risk. The pool deck zone requires a separate cleaning protocol — typically a manual daily deep clean supplemented by the facility's existing pool maintenance systems.
- Patient privacy: Robots operating in treatment bays with drawn curtains must be programmed to announce their presence ("Cleaning cycle starting in Treatment Bay 4") and wait 5 seconds before entering, giving therapists time to ensure patient modesty.
- Therapist scheduling integration: The EMR integration that enables appointment-driven cleaning is the single highest-ROI technical component of the deployment. Without it, cleaning happens on a fixed schedule that may or may not align with actual patient flow. With it, cleaning is demand-driven and perfectly synchronized to clinical workflow.
For the full deployment planning framework applicable across healthcare settings, the vendor evaluation framework guide provides a structured assessment methodology for comparing robot platforms and integration partners.
Rehabilitation centers that deploy autonomous robots for cleaning and logistics free their therapists to do what they trained for — treat patients — while maintaining the facility cleanliness and operational efficiency that drive both clinical outcomes and practice profitability.